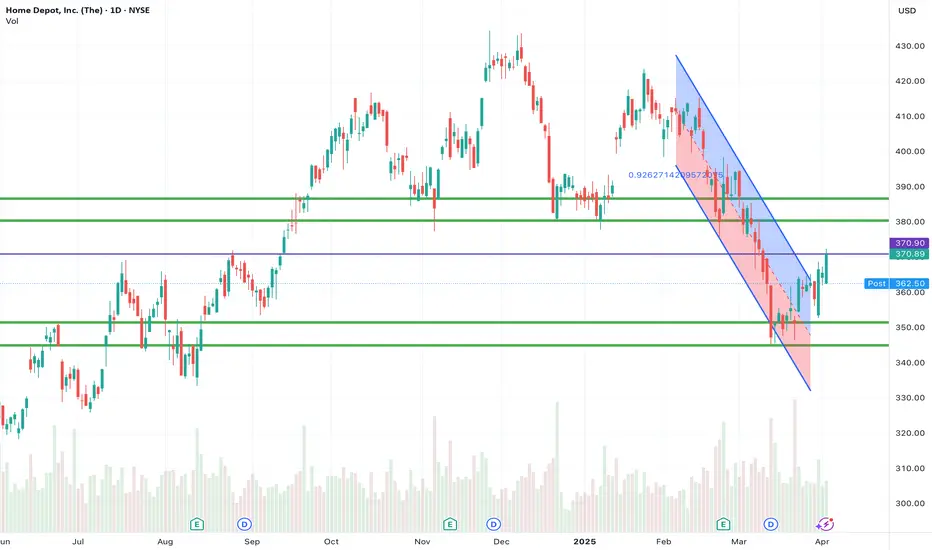
Home Depot's chart shows it just broke out of a descending channel! After a steady downtrend, it's pushing past resistance around $370. Is this the start of a sustained rally, or a temporary blip before it heads back down? Keep an eye on the next resistance level near $383 – a break above that would strengthen the bullish case. Are you betting on HD's strength, or seeing a potential pullback?
免責聲明
這些資訊和出版物並不意味著也不構成TradingView提供或認可的金融、投資、交易或其他類型的意見或建議。請在使用條款閱讀更多資訊。
免責聲明
這些資訊和出版物並不意味著也不構成TradingView提供或認可的金融、投資、交易或其他類型的意見或建議。請在使用條款閱讀更多資訊。