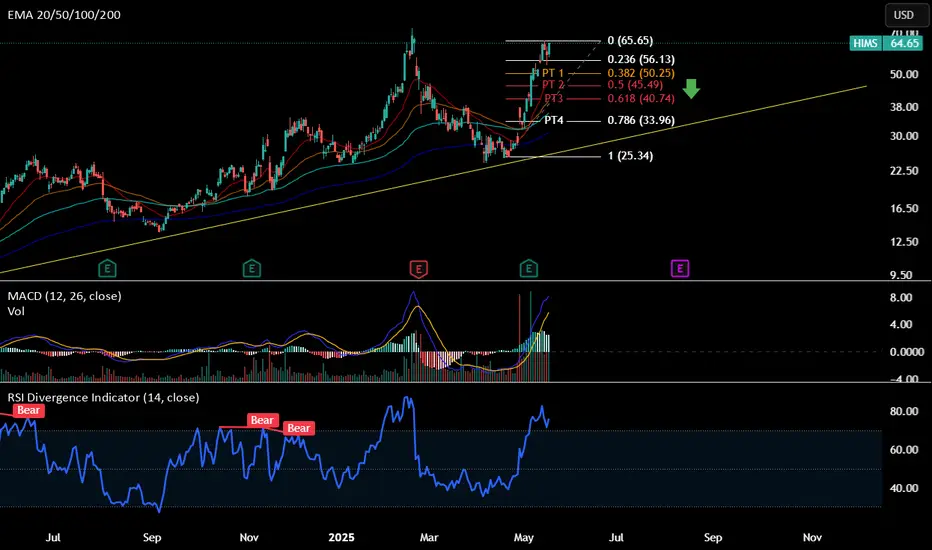
Long-term trend line: Rising trend line -> short-term bearish due to expected trend line retest (yellow trend line)
Daily MACD & RSI : Overbought -> expect a pull back
Support Line to enter PUT: ~$54
Expected time zone for pullback: 30 days to 50 days
PT1: ~50.25
PT2: ~45.49
PT3: ~40.74
PT4: ~34.96
Possible PT5: expect to cross down the EMA 200 at ~$27, which is close to the trendline support. However, I'll exit all play at PT4.
交易進行
Support line breaks -> PUT active註釋
Take profits from one time hits $54 and today at 52.5$54 is a very stubborn support
註釋
PUT option if $51 breaksStop loss: ~54
HIMS seems like it wants to retest the ATH ~72.9 as it has been accumulating for days in range 51.8 -56
交易結束:目標達成
註釋
HIMS rejected hard at the resistance at $67-> this PUT play to reach PT 2 might be active again if it breaks support at $51.3免責聲明
這些資訊和出版物並不意味著也不構成TradingView提供或認可的金融、投資、交易或其他類型的意見或建議。請在使用條款閱讀更多資訊。
免責聲明
這些資訊和出版物並不意味著也不構成TradingView提供或認可的金融、投資、交易或其他類型的意見或建議。請在使用條款閱讀更多資訊。