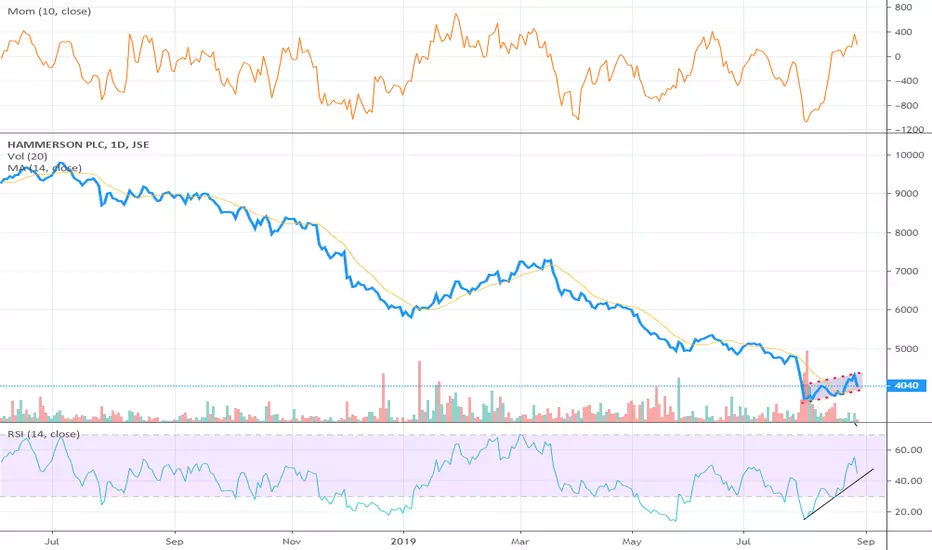
Yesterday I published ah hourly chart of $JSEHMN, with a question: is this another false b/o? It turned out it was and with the price reversal, the daily chart now clearly shows a bearish flag formation.
I am looking for a close below 3920/25 for the break out with intermittent support around 3811 later 3711.
Full target on the downside is around 2861
I am looking for a close below 3920/25 for the break out with intermittent support around 3811 later 3711.
Full target on the downside is around 2861
免責聲明
這些資訊和出版物並不意味著也不構成TradingView提供或認可的金融、投資、交易或其他類型的意見或建議。請在使用條款閱讀更多資訊。