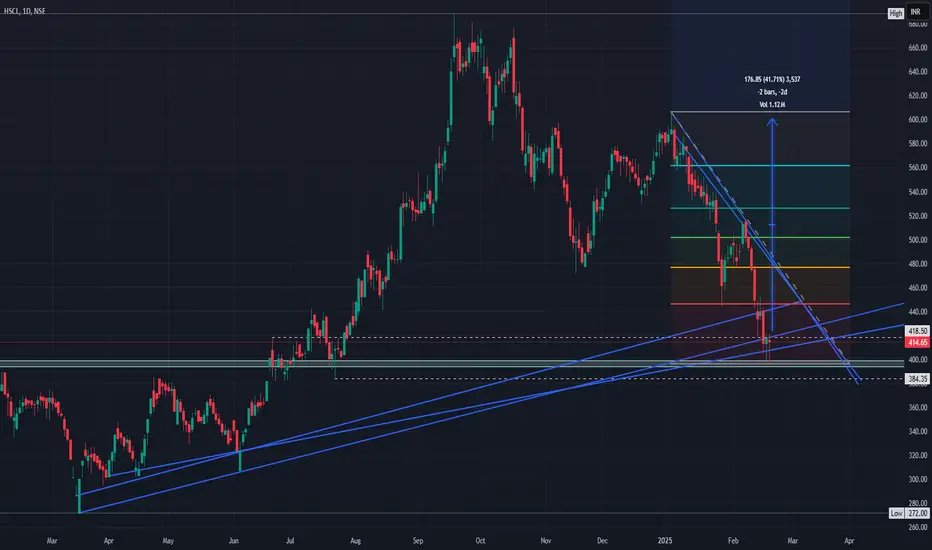
Downtrend Correction : The stock has been falling from recent highs but is near key support (~₹412).
Descending Trendline : Price is trying to break above the downward sloping line; a breakout could signal a bullish reversal.
Fibonacci Targets : Potential upside targets are around ₹485, ₹506, and ₹557 if the breakout holds.
Risk Level: A break below ₹412 support may lead to further downside.
Descending Trendline : Price is trying to break above the downward sloping line; a breakout could signal a bullish reversal.
Fibonacci Targets : Potential upside targets are around ₹485, ₹506, and ₹557 if the breakout holds.
Risk Level: A break below ₹412 support may lead to further downside.
註釋
You can TSL C2C!LOW RISK? PLAY HUGE!
Follow for latest updates and valuable financial content
✆ t.me/iVishalPal
Yt: t.ly/frb4G
LinkedIn: t.ly/g_SjB
WhatsApp: t.ly/_6T9j
TradingView: t.ly/-UGgZ
Telegram: t.me/traderpulseyt
Follow for latest updates and valuable financial content
✆ t.me/iVishalPal
Yt: t.ly/frb4G
LinkedIn: t.ly/g_SjB
WhatsApp: t.ly/_6T9j
TradingView: t.ly/-UGgZ
Telegram: t.me/traderpulseyt
免責聲明
這些資訊和出版物並非旨在提供,也不構成TradingView提供或認可的任何形式的財務、投資、交易或其他類型的建議或推薦。請閱讀使用條款以了解更多資訊。
LOW RISK? PLAY HUGE!
Follow for latest updates and valuable financial content
✆ t.me/iVishalPal
Yt: t.ly/frb4G
LinkedIn: t.ly/g_SjB
WhatsApp: t.ly/_6T9j
TradingView: t.ly/-UGgZ
Telegram: t.me/traderpulseyt
Follow for latest updates and valuable financial content
✆ t.me/iVishalPal
Yt: t.ly/frb4G
LinkedIn: t.ly/g_SjB
WhatsApp: t.ly/_6T9j
TradingView: t.ly/-UGgZ
Telegram: t.me/traderpulseyt
免責聲明
這些資訊和出版物並非旨在提供,也不構成TradingView提供或認可的任何形式的財務、投資、交易或其他類型的建議或推薦。請閱讀使用條款以了解更多資訊。