History & Context:
Trade Setup:
Disclaimer: This is not financial advice and is for educational purposes only. Trading stocks involves risk, and you should carefully consider your risk tolerance and consult with a financial advisor before making any investment decisions. Past performance is not indicative of future results.
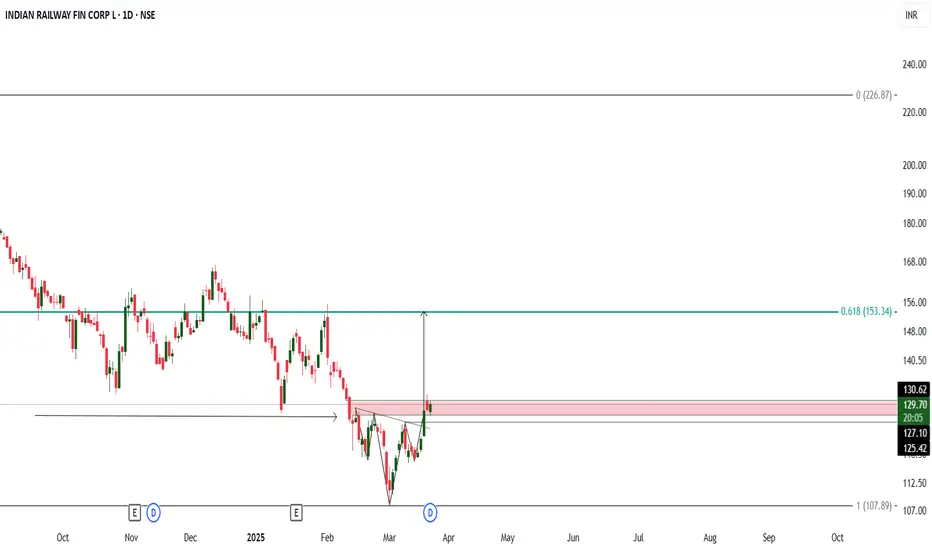
- Previous Decline: IRFC has fallen from its top of 227 to its bottom of 108, representing a 53% decline.
- Recovery: The stock has recovered 17% from its bottom, indicating some strength.
- Inverted Head and Shoulders: Over the past 22 days, the stock has formed an Inverted Head and Shoulders pattern, which typically signals accumulation at lower levels and potential reversal.
- Pattern Identification: The chart shows an Inverted Head and Shoulders pattern, suggesting a potential reversal from a downtrend to an uptrend.
- Breakout Point: The neckline is identified around 127.28, and a breakout above this level could confirm the pattern, signaling further upward movement.
- Price Target: The projected target based on the Inverted Head and Shoulders pattern is around 150.50, which aligns with the 61.8% retracement level.
- Stop Loss: A stop loss can be set below the right shoulder at 125.42, protecting against a potential reversal.
Trade Setup:
- Entry Point: Buy around 127.28 (Breakout of the neckline).
- Target Price: 150.50 (around 20% potential gain).
- Stop Loss: 125.42 (below the right shoulder).
Disclaimer: This is not financial advice and is for educational purposes only. Trading stocks involves risk, and you should carefully consider your risk tolerance and consult with a financial advisor before making any investment decisions. Past performance is not indicative of future results.
免責聲明
這些資訊和出版物並不意味著也不構成TradingView提供或認可的金融、投資、交易或其他類型的意見或建議。請在使用條款閱讀更多資訊。
免責聲明
這些資訊和出版物並不意味著也不構成TradingView提供或認可的金融、投資、交易或其他類型的意見或建議。請在使用條款閱讀更多資訊。
