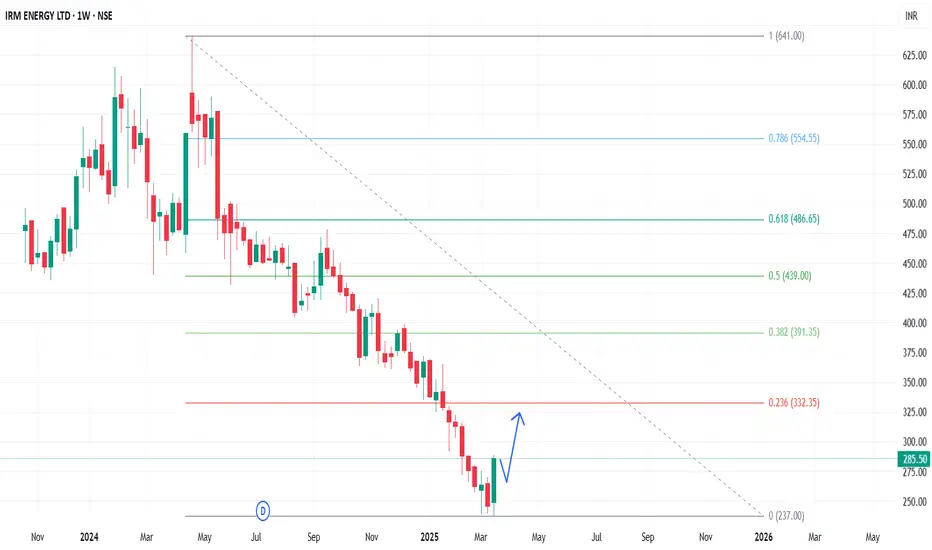
In the Weekly Chart of IRMENERGY ,
we can see that; it has given a W shape recovery from 240 levels.
Let it create a halt candle and then enter with SL & Targets.
Expected momentum is shown in chart.
we can see that; it has given a W shape recovery from 240 levels.
Let it create a halt candle and then enter with SL & Targets.
Expected momentum is shown in chart.
免責聲明
這些資訊和出版物並不意味著也不構成TradingView提供或認可的金融、投資、交易或其他類型的意見或建議。請在使用條款閱讀更多資訊。
免責聲明
這些資訊和出版物並不意味著也不構成TradingView提供或認可的金融、投資、交易或其他類型的意見或建議。請在使用條款閱讀更多資訊。