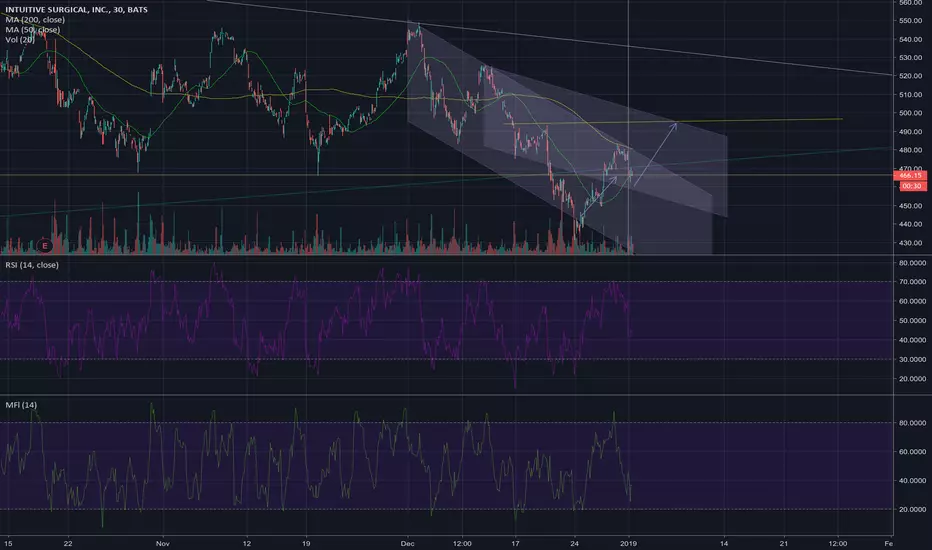
Check the chart and you'll see no less than 5 diff H&S patterns going both ways in the past several months... Expecting this one to play out as well. The yellow line is the daily 200DMA, expecting this to retest that before moving back down in a mid-late jan selloff as the broader market retests the xmas lows. Risk is definitely to the upside on this trade tho so tread carefully and bail if indices cannot break its downward trend from dec in the next several days.
免責聲明
這些資訊和出版物並不意味著也不構成TradingView提供或認可的金融、投資、交易或其他類型的意見或建議。請在使用條款閱讀更多資訊。
免責聲明
這些資訊和出版物並不意味著也不構成TradingView提供或認可的金融、投資、交易或其他類型的意見或建議。請在使用條款閱讀更多資訊。