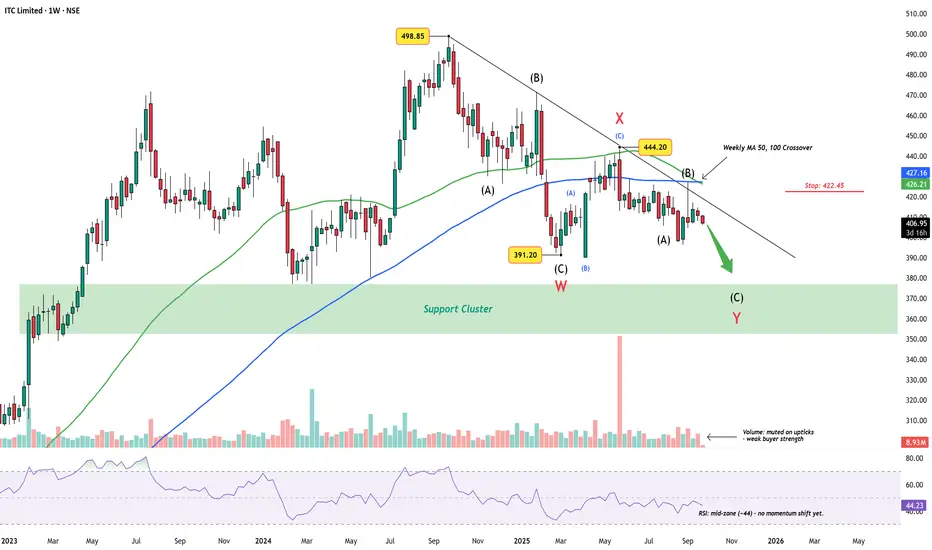
ITC has been trending lower since the ₹498.85 peak, carving out what appears to be a complex W-X-Y correction. The first leg (W) found support near ₹391.20, followed by a corrective bounce into X at ₹444.20. The decline since then has kept price under a descending trendline, respecting the larger corrective rhythm.
Wave Count
The broader structure hints that ITC may continue toward the support cluster (₹350–375) before this correction runs its course.
Indicators
Invalidation
A decisive break above ₹422.45 and sustained strength beyond 427 would question this bearish view, hinting at a possible shift back to bullish sequences.
Summary
Unless ITC reclaims higher ground above 422.45, the bias stays toward a Wave Y completion in the support cluster zone.
Disclaimer: This analysis is for educational purposes only and does not constitute investment advice. Please do your own research (DYOR) before making any trading decisions.
Wave Count
- Wave W: Completed into the ₹391.20 low.
- Wave X: Counter-trend rally capped at 444.20.
- Wave Y: Now unfolding, with sub-wave (C) still incomplete.
The broader structure hints that ITC may continue toward the support cluster (₹350–375) before this correction runs its course.
Indicators
- Volume: Muted on upticks – rallies lack buying strength.
- RSI (~44): Mid-zone, leaving space for further downside before oversold conditions.
- Weekly 50/100 MA crossover: Adds weight to the ongoing corrective bias.
Invalidation
A decisive break above ₹422.45 and sustained strength beyond 427 would question this bearish view, hinting at a possible shift back to bullish sequences.
Summary
Unless ITC reclaims higher ground above 422.45, the bias stays toward a Wave Y completion in the support cluster zone.
Disclaimer: This analysis is for educational purposes only and does not constitute investment advice. Please do your own research (DYOR) before making any trading decisions.
WaveXplorer | Elliott Wave insights
📊 X profile: @veerappa89
📊 X profile: @veerappa89
相關出版品
免責聲明
這些資訊和出版物並非旨在提供,也不構成TradingView提供或認可的任何形式的財務、投資、交易或其他類型的建議或推薦。請閱讀使用條款以了解更多資訊。
WaveXplorer | Elliott Wave insights
📊 X profile: @veerappa89
📊 X profile: @veerappa89
相關出版品
免責聲明
這些資訊和出版物並非旨在提供,也不構成TradingView提供或認可的任何形式的財務、投資、交易或其他類型的建議或推薦。請閱讀使用條款以了解更多資訊。