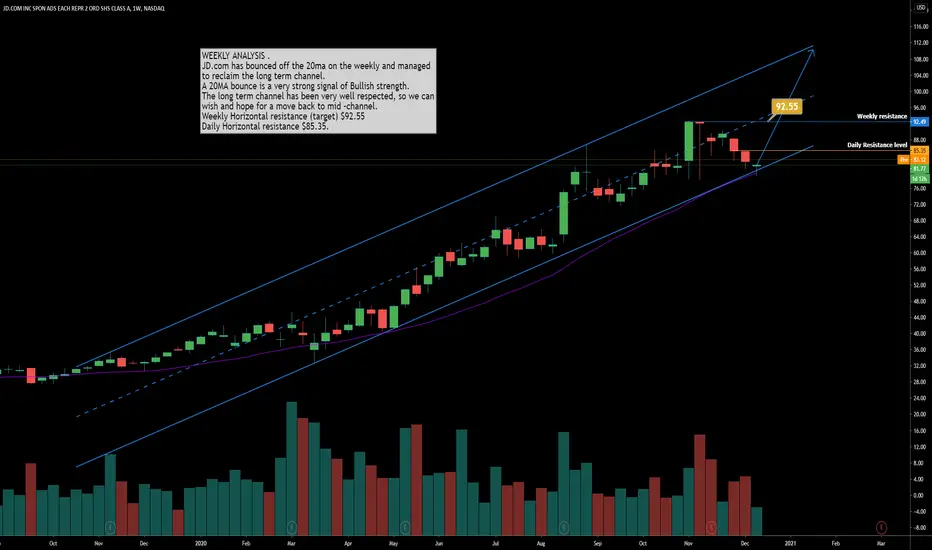
JD.com has bounced off the 20ma on the weekly and managed
to reclaim the long term channel.
A 20MA bounce is a very strong signal of Bullish strength.
The long term channel has been very well respected, so we can
wish and hope for a move back to mid -channel.
Weekly Horizontal resistance (target) $92.55
Daily Horizontal resistance $85.35.
註釋
註釋
Daily chart shows a safer entry above MA's免責聲明
這些資訊和出版物並不意味著也不構成TradingView提供或認可的金融、投資、交易或其他類型的意見或建議。請在使用條款閱讀更多資訊。
免責聲明
這些資訊和出版物並不意味著也不構成TradingView提供或認可的金融、投資、交易或其他類型的意見或建議。請在使用條款閱讀更多資訊。