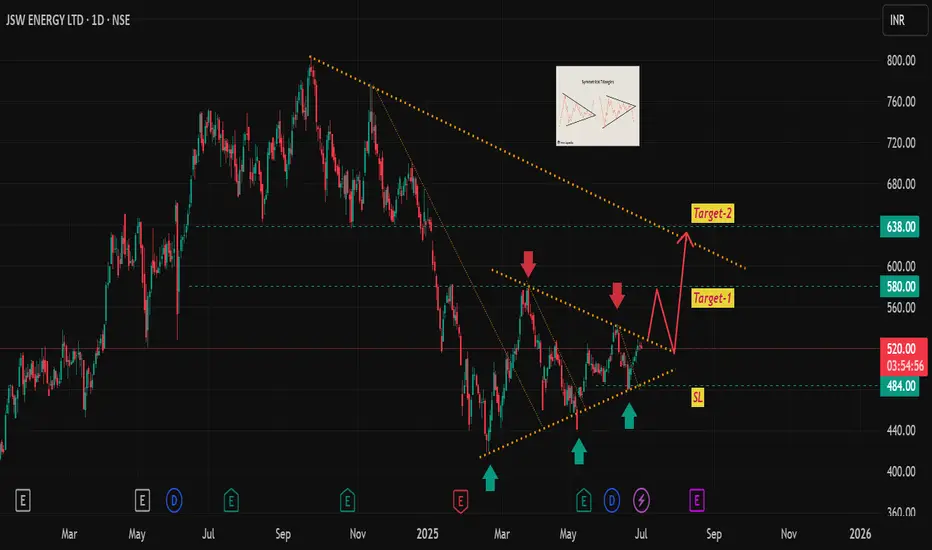
JSW Energy - under the formation of symmetric triangle chart pattern, it is near to breakout level, one can go long (short term) here, stop loss and targets are mentioned in the chart.
Please note: I am not a certified stock analyst, this chart is purely for education purpose, request you to do your own financial assessment before investment/trade.
Please note: I am not a certified stock analyst, this chart is purely for education purpose, request you to do your own financial assessment before investment/trade.
免責聲明
這些資訊和出版物並不意味著也不構成TradingView提供或認可的金融、投資、交易或其他類型的意見或建議。請在使用條款閱讀更多資訊。