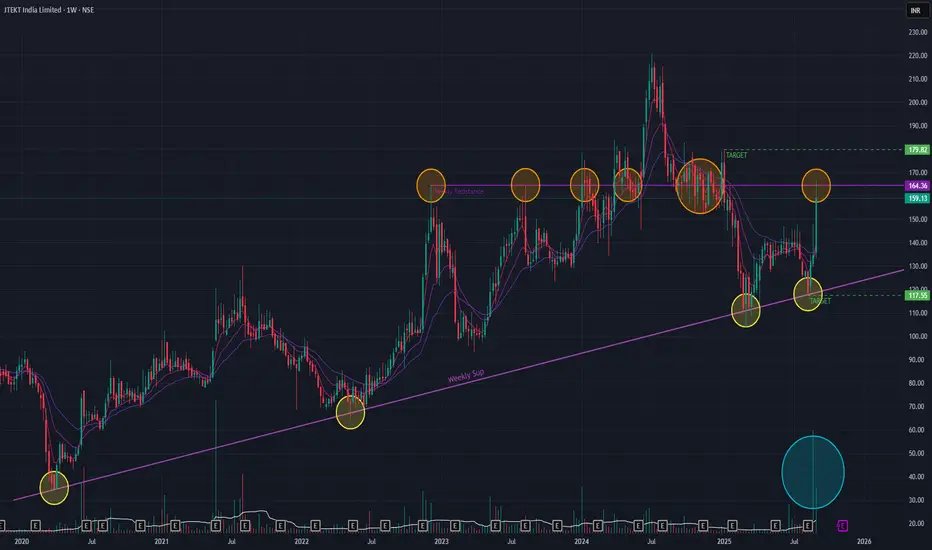
JTEKT is on an uptrend and have been respecting the support trendline as indicated. Since Dec 2022, the stock made several attempts to BreakOut of a major resistance zone and was successful once in Breaking Out and making an All Time High (ATH) in Jun 2024. As of last week the stock surged by 18+ % with huge volume. During this process the short-term EMAs did a positive cross-over. All of these are bullish signals.
During the coming week, if the stock is able to showcase bullish price-action then the stock may reach 179 levels. In a profit booking scenario, we may see the stock go down to 117 levels.
Keep watching for next week's price-action.
During the coming week, if the stock is able to showcase bullish price-action then the stock may reach 179 levels. In a profit booking scenario, we may see the stock go down to 117 levels.
Keep watching for next week's price-action.
Disclaimer: This analysis is my personal view & for educational purposes only. They shall not be construed as trade or investment advice. Before making any financial decision, it is imperative that you consult with a qualified financial professional.
免責聲明
這些資訊和出版物並不意味著也不構成TradingView提供或認可的金融、投資、交易或其他類型的意見或建議。請在使用條款閱讀更多資訊。