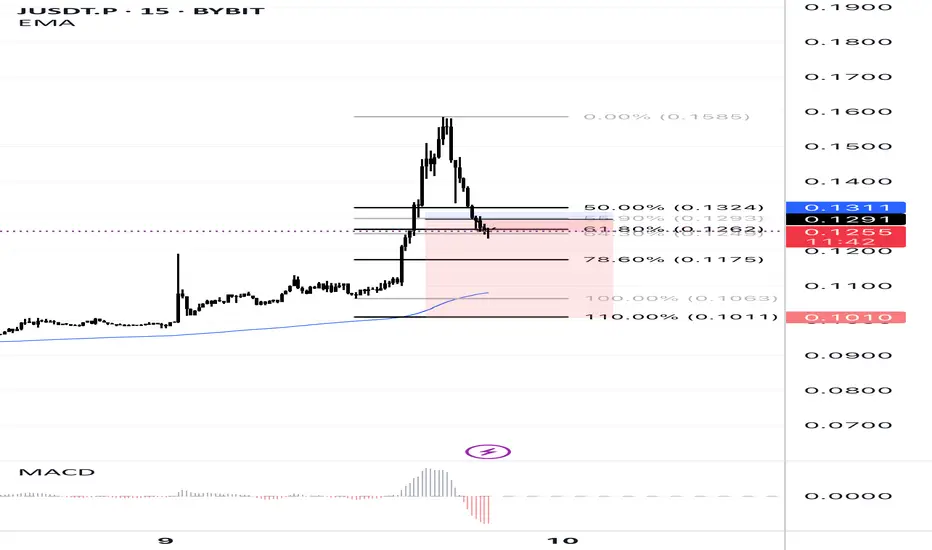
This 15-minute chart of JUSDT.P highlights a sharp price spike followed by a retracement. Key Fibonacci levels (50%, 61.8%, 78.6%) are marked to identify potential support zones. The price is currently testing the 61.8% retracement level, with the EMA acting as dynamic support. MACD shows bearish momentum after the recent peak, indicating a possible continuation of the retracement or consolidation phase. Watch for price action around the 0.1260 - 0.1320 range for potential reversal or breakdown.
免責聲明
這些資訊和出版物並不意味著也不構成TradingView提供或認可的金融、投資、交易或其他類型的意見或建議。請在使用條款閱讀更多資訊。
免責聲明
這些資訊和出版物並不意味著也不構成TradingView提供或認可的金融、投資、交易或其他類型的意見或建議。請在使用條款閱讀更多資訊。