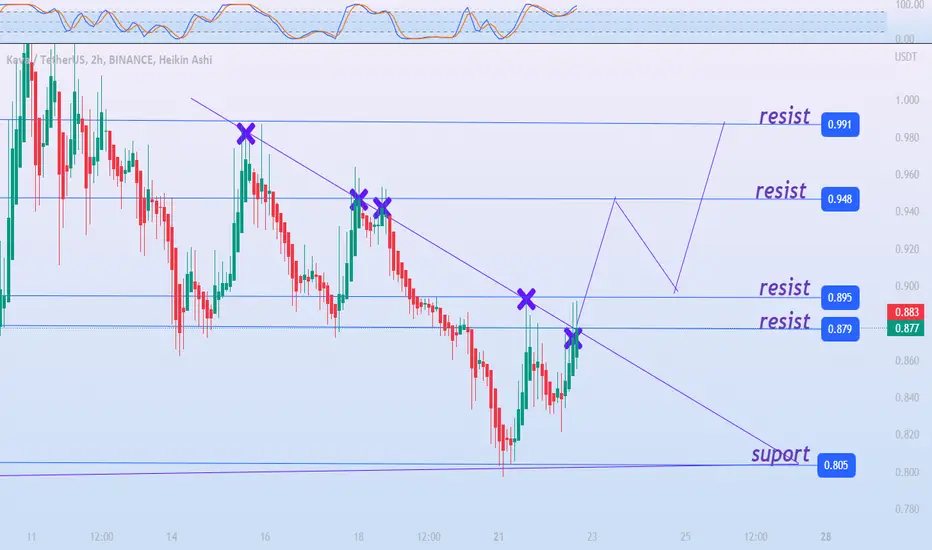
The above graph of Kava (KAVA) shows a triangle pattern. This pattern is being broken as the graph shows. The oversold indicated by the RSI may push the price of KAVA towards 0.852. It follows its supports and resistances.
Supports: 0.852 / 0.805
Resistances: 0.895 / 0.948 / 0.991
Supports: 0.852 / 0.805
Resistances: 0.895 / 0.948 / 0.991
免責聲明
這些資訊和出版物並不意味著也不構成TradingView提供或認可的金融、投資、交易或其他類型的意見或建議。請在使用條款閱讀更多資訊。
免責聲明
這些資訊和出版物並不意味著也不構成TradingView提供或認可的金融、投資、交易或其他類型的意見或建議。請在使用條款閱讀更多資訊。