Technical Analysis of KSE 100 Index (15-minute timeframe) 07-10-2025
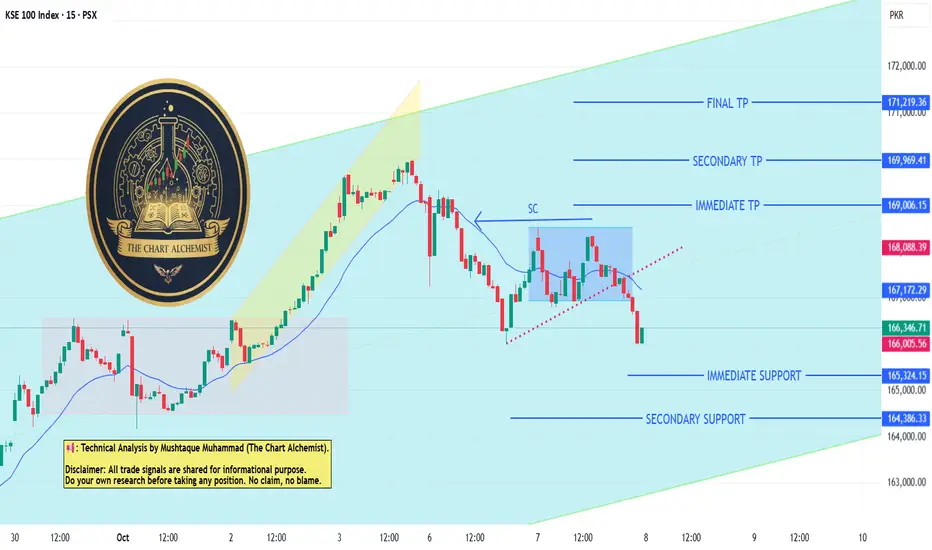
Contrary to our previous analysis, the index didn't achieve the given targets. Instead, it formed a DT Bear Flag pattern and broke down below it (marked with a red dotted line). We expect the index to continue moving lower, targeting immediate and secondary support levels at:
- 165,300
- 164,400
The index is expected to touch the bottom of the HTF (Higher Time Frame) channel before making another attempt to reverse and achieve the previously given targets.
免責聲明
這些資訊和出版物並不意味著也不構成TradingView提供或認可的金融、投資、交易或其他類型的意見或建議。請在使用條款閱讀更多資訊。
免責聲明
這些資訊和出版物並不意味著也不構成TradingView提供或認可的金融、投資、交易或其他類型的意見或建議。請在使用條款閱讀更多資訊。