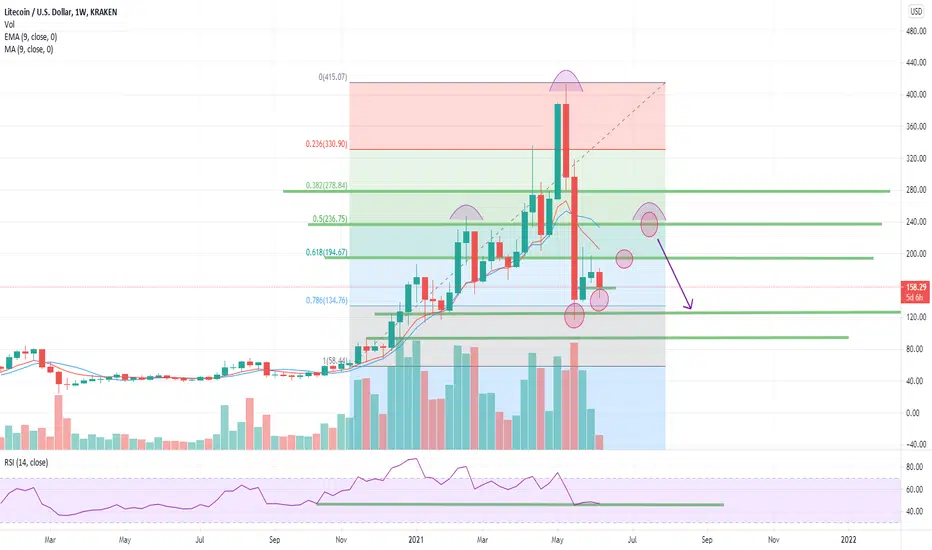
We continued to the downside, contrary to what I was expecting. So now we are looking at the weekly chart.
This is just another iteration of my previous ideas. This time, you can see the levels of resistance and support align with the fib levels. This retracement has gone deep into the gains of the last impulse. The Chart shows a potential for continued higher lows. The rsi is at 47 at time of post. If the shoulder is completed, I see a potential short opportunity coming.
This is not financial advice. This is for my reference and record as a hobby trader.
Related ideas linked.
免責聲明
這些資訊和出版物並非旨在提供,也不構成TradingView提供或認可的任何形式的財務、投資、交易或其他類型的建議或推薦。請閱讀使用條款以了解更多資訊。