Potential short case based on technical analysis patterns and trendline analysis.
The analysis is based on two timeframes: the Weekly (1W) and the 4-Hour (4h) charts.
Technical Analysis for MDB Short Case
1. Head and Shoulders Pattern (4h Chart)
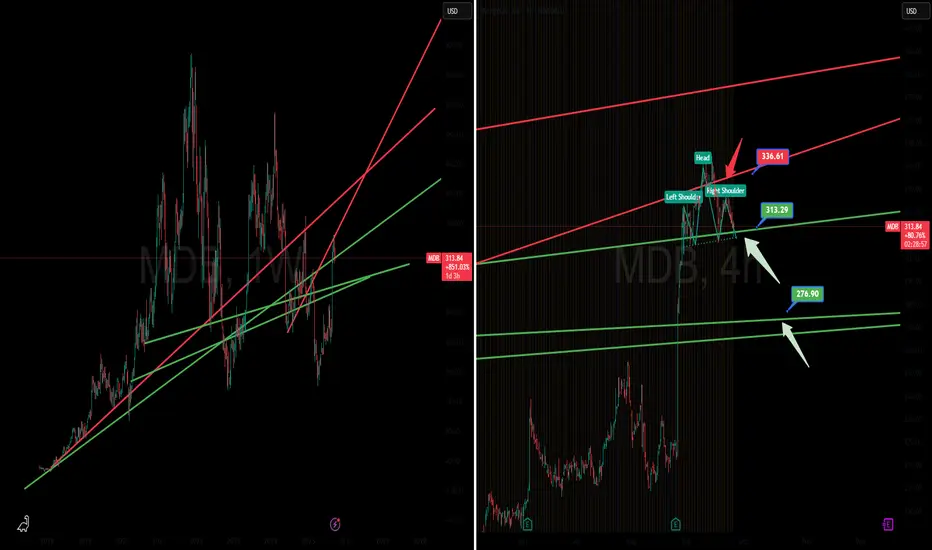
The most prominent feature is the potential formation of a Head and Shoulders (H&S) topping pattern on the 4h chart, a classic bearish reversal pattern.
Left Shoulder: A peak formed just above the $313.29 green trendline/neckline.
Head: The highest peak in the pattern, marked at $338.61.
Right Shoulder: A peak currently forming and testing the resistance line, appearing to roll over.
Neckline: The $313.29 green horizontal line appears to be the neckline/key support level for this pattern.
A confirmed breakdown (close) below the neckline at $313.29 would validate the pattern and project a significant downward move.
2. Trendline & Support/Resistance Analysis
The chart also overlays several long-term trendlines and key price levels.
Resistance/Upper Trendline (Red): This line represents the long-term upward channel resistance. The stock's head at $338.61 peaked right at this resistance.
Key Support (Green Trendline): This line, running through the middle of the price action on the 1W chart, has been broken by the recent price action, with the neckline for the H&S pattern forming right near this general support area, around $313.29.
Initial Downside Target (Green Box): A projected target level, likely derived from the H&S pattern's measurement, is marked at $276.90. This level is also aligned with a lower support trendline on the 4h chart.
GoldenTraders is a premier trading community dedicated to helping you navigate the complexities of the financial markets with confidence and clarity.
Please join for more trade Ideas.
GoldenTraders: discord.gg/nrCvUT8yzt
Please join for more trade Ideas.
GoldenTraders: discord.gg/nrCvUT8yzt
免責聲明
這些資訊和出版物並非旨在提供,也不構成TradingView提供或認可的任何形式的財務、投資、交易或其他類型的建議或推薦。請閱讀使用條款以了解更多資訊。