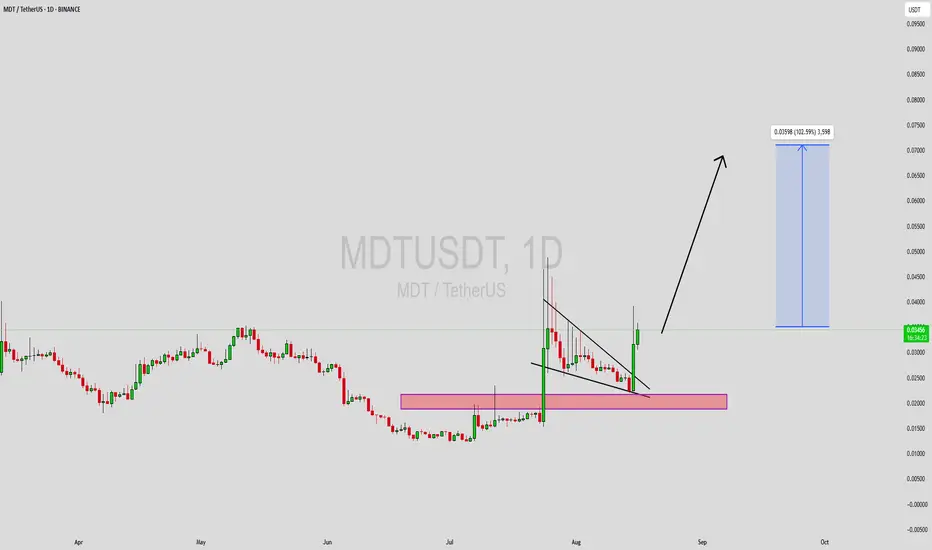
MDTUSDT is currently forming a classic descending triangle pattern, which is typically a continuation pattern suggesting potential for a strong move once a breakout occurs. The price structure is showing repeated lower highs while maintaining a relatively stable support level, indicating pressure is building up. This kind of technical setup often results in a sharp breakout if supported by increasing volume and broader market sentiment.
With good volume already observed on recent candles, the chances of a bullish breakout are increasing. The descending triangle pattern has been developing over time, and the current positioning near the breakout level is promising. If MDTUSDT breaks above the resistance zone, a strong rally toward the projected 90% to 100% gain is highly probable, especially considering growing investor interest in the project.
This setup aligns with key bullish trading strategies, particularly for those watching for momentum-based breakouts. Traders should keep an eye on volume spikes and candle confirmations at resistance to validate entry points. As the pattern matures, the potential for a trend reversal or breakout continuation becomes more evident, especially on higher time frames like the daily or weekly charts.
✅ Show your support by hitting the like button and
✅ Leaving a comment below! (What is You opinion about this Coin)
Your feedback and engagement keep me inspired to share more insightful market analysis with you!
🟢🟢🟢Join Our Telegram Here to Get Trades With Entry And Exit 🟢🟢🟢
cryptotelegram.bio.link/
🟢🟢🟢
cryptotelegram.bio.link/
🟢🟢🟢
免責聲明
這些資訊和出版物並非旨在提供,也不構成TradingView提供或認可的任何形式的財務、投資、交易或其他類型的建議或推薦。請閱讀使用條款以了解更多資訊。
🟢🟢🟢Join Our Telegram Here to Get Trades With Entry And Exit 🟢🟢🟢
cryptotelegram.bio.link/
🟢🟢🟢
cryptotelegram.bio.link/
🟢🟢🟢
免責聲明
這些資訊和出版物並非旨在提供,也不構成TradingView提供或認可的任何形式的財務、投資、交易或其他類型的建議或推薦。請閱讀使用條款以了解更多資訊。