Moderna is currently on a bull flag.
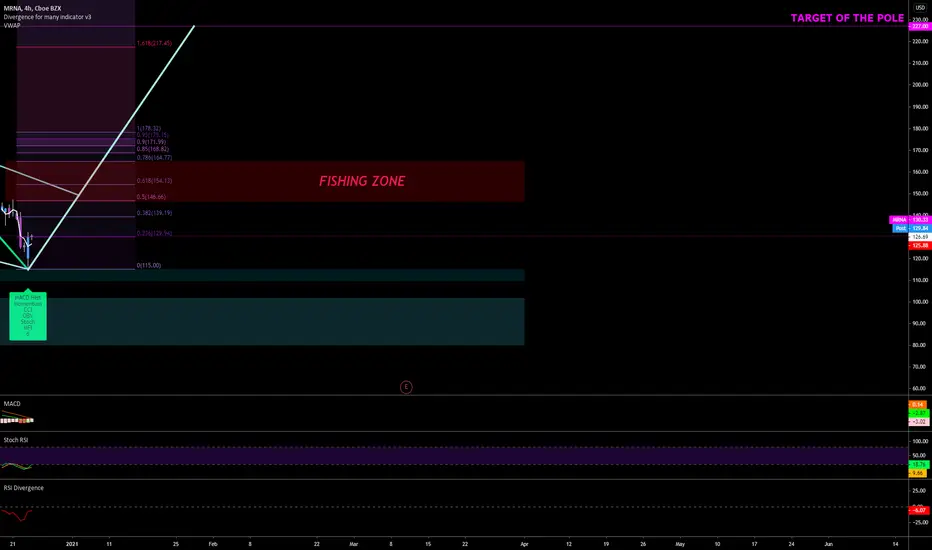
Last retracement is very positive. The breeder finally came and there is still some place to lower around 110$ where the bottom of the gap up is ! I would not be surprised is MRNA go there but usualy if the bull trend continue the daily MA 21 will offer support and this is currently what we are seeing. Daily MA 21 is at 125.78$. Price came back over the daily Vwap today.. this can push the price quicky around the fishing trap zone around 154.13, but 146.46$ should offer a good resistance. MRNA is in a great posture for a continuation right now...
Here are some key points to watch :
-Currently on a potential Bull Flag with a target over 200$
-Bullish divergence on the 4 hour chart on MACD, Momentum, CCI, OBV, STOCH and MFI.
-Support seem to be strong on the daily MA 21
-Price now over VWAP which is now support at 126.69
-Stoch RSI is crossing on the upside on the 4 hours
-Weekly MA 7 and MA 9 offer support at 127.72$ and 114.89$
-4 hours MA 21 offer support at 126.69
-RSI is turning on the upside
-Daily MACD is still in bullish territory
-Bottom of 4hr Donchian channel reached at 115$
-Bottom of 4hrs and 1day chart Bollinger Band reached
-Bottom of Donchian Channel is at 98.65$ (can the price go there) Maybe but!
-Median line of the weekly Bollinger Band is at 89.23$ (can the price go there) Maybe but!
Merry Christmas ! Much love!
交易進行
Let's speculate MRNA is on a W2. Divergence is indicating us were we can find W5. 註釋
108.67 is the Golden Fib 61.8 and 0.5 in logarithmic.註釋
If we lose the golden fib, here what Renko is telling us註釋
Bullish pattern?註釋
breakout註釋
註釋
免責聲明
這些資訊和出版物並不意味著也不構成TradingView提供或認可的金融、投資、交易或其他類型的意見或建議。請在使用條款閱讀更多資訊。
免責聲明
這些資訊和出版物並不意味著也不構成TradingView提供或認可的金融、投資、交易或其他類型的意見或建議。請在使用條款閱讀更多資訊。