Market Participants play the role of
1. price discovery
2. shift in the trends and change of cycles
3. Value rotation among different asset classes
Market players like Yearly, Halfyearly, Quarterly, Monthly, weekly, Daily, Hourly, and Intraday participants who trade during certain time ranges.
Apart form these certain market makers who has ability to shift the entire market cycle. who participate during very crucial times.
Coming to Natural gas Price movement
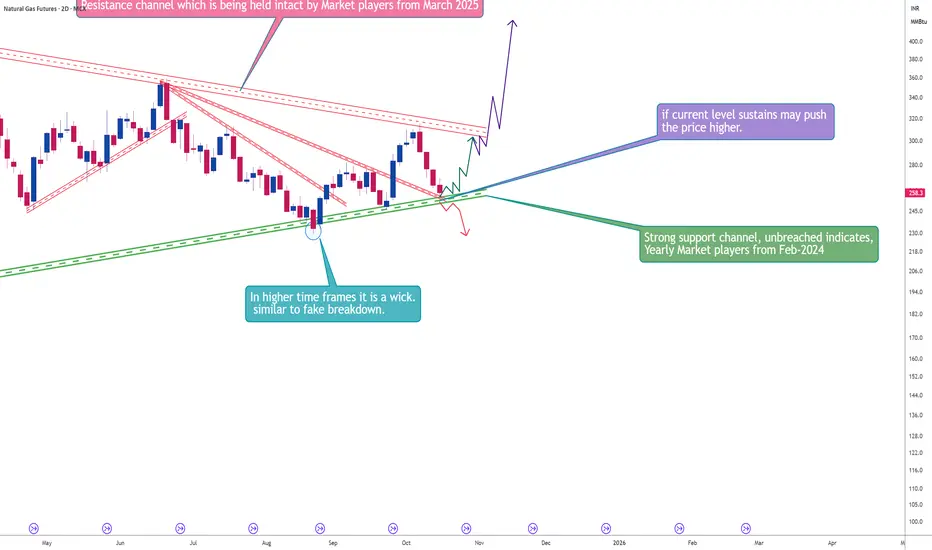
Case 1 :
it is very clear form the chart that a resistance channel which is held from march 2025 of this financial year ( Indicates presence of (may be Yearly), quarterly, halfyerly, or may be some other lower level weekly and daily participants).
to explain this 2day chart is considered where we can see a continuous 8 trading sessions of red candles appeared.
now if continues further for next couple of trading sessions it not a good sign for naturalgas.
Case 2 :
A strong green support channel is being held intact from feb-2024 which indicates presence of Mainly Yearly participants
if this channel is held intact around 260 levels for couple of days may push the price to much higher levels.
Looks like its a tight fight between different players. if green channel is respected then price moves to higher levels, else it goes down eventually. lets see which players are going to win.
1. price discovery
2. shift in the trends and change of cycles
3. Value rotation among different asset classes
Market players like Yearly, Halfyearly, Quarterly, Monthly, weekly, Daily, Hourly, and Intraday participants who trade during certain time ranges.
Apart form these certain market makers who has ability to shift the entire market cycle. who participate during very crucial times.
Coming to Natural gas Price movement
Case 1 :
it is very clear form the chart that a resistance channel which is held from march 2025 of this financial year ( Indicates presence of (may be Yearly), quarterly, halfyerly, or may be some other lower level weekly and daily participants).
to explain this 2day chart is considered where we can see a continuous 8 trading sessions of red candles appeared.
now if continues further for next couple of trading sessions it not a good sign for naturalgas.
Case 2 :
A strong green support channel is being held intact from feb-2024 which indicates presence of Mainly Yearly participants
if this channel is held intact around 260 levels for couple of days may push the price to much higher levels.
Looks like its a tight fight between different players. if green channel is respected then price moves to higher levels, else it goes down eventually. lets see which players are going to win.
交易進行
Sustaining 260 levels. now we can expect a good upside move in the price trajectory shown註釋
if sustains current levels 15-20% upward movement is clear on the charts.免責聲明
這些資訊和出版物並不意味著也不構成TradingView提供或認可的金融、投資、交易或其他類型的意見或建議。請在使用條款閱讀更多資訊。
免責聲明
這些資訊和出版物並不意味著也不構成TradingView提供或認可的金融、投資、交易或其他類型的意見或建議。請在使用條款閱讀更多資訊。