🔍 Key Highlights:
✅ XABCD Pattern Completion Zone:
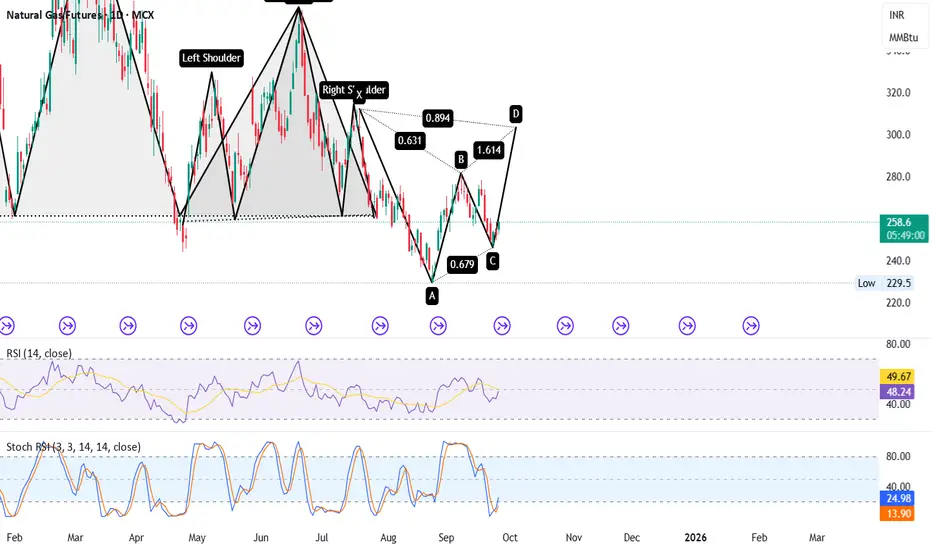
XA to AB = 0.631 retracement
BC = 0.679 retracement
CD = 1.614 extension (projected move towards Point D)
✅ Bullish Structure in Progress:
Hidden Inverse Head & Shoulder supports bullish reversal
Confluence near Point C, increasing probability of trend reversal
✅ Momentum Confirmation:
RSI bouncing from neutral zone (47–49)
Stoch RSI reversing from oversold zone (13–23) – signaling early long buildup
🎯 Key Levels to Watch:
📈 Upside Target Zone (D): 1.614 extension zone
🛑 Invalidation: Break below recent Point C Low (229.5)
💡 Trading Insight:
This setup aligns with harmonic precision. If price holds the recent low and reverses with volume, Natural Gas may witness a strong upside bounce into the D leg completion.
✅ XABCD Pattern Completion Zone:
XA to AB = 0.631 retracement
BC = 0.679 retracement
CD = 1.614 extension (projected move towards Point D)
✅ Bullish Structure in Progress:
Hidden Inverse Head & Shoulder supports bullish reversal
Confluence near Point C, increasing probability of trend reversal
✅ Momentum Confirmation:
RSI bouncing from neutral zone (47–49)
Stoch RSI reversing from oversold zone (13–23) – signaling early long buildup
🎯 Key Levels to Watch:
📈 Upside Target Zone (D): 1.614 extension zone
🛑 Invalidation: Break below recent Point C Low (229.5)
💡 Trading Insight:
This setup aligns with harmonic precision. If price holds the recent low and reverses with volume, Natural Gas may witness a strong upside bounce into the D leg completion.
免責聲明
這些資訊和出版物並不意味著也不構成TradingView提供或認可的金融、投資、交易或其他類型的意見或建議。請在使用條款閱讀更多資訊。
免責聲明
這些資訊和出版物並不意味著也不構成TradingView提供或認可的金融、投資、交易或其他類型的意見或建議。請在使用條款閱讀更多資訊。