Let’s break down the Natural Gas Futures (INR) Weekly Chart step-by-step.
This will include chart structure, patterns, demand–supply zones, and precise support/resistance levels based on what I can see on the charts :
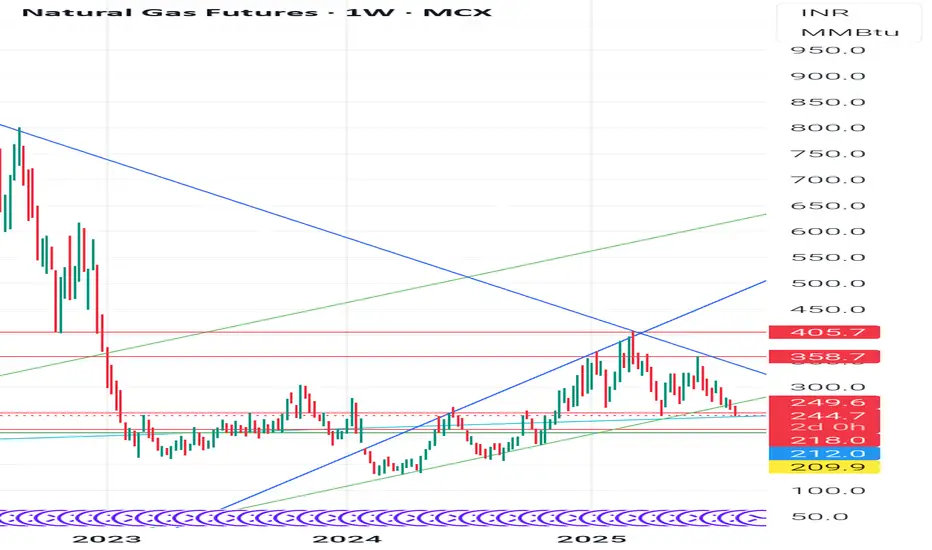
🔍Chart OverviewTimeframe: Weekly (1W)Current Price: ₹244.7 (down -5.30%)Price is near an important ascending trendline support (green line) after a strong correction from recent highs. Structure shows earlier breakout above descending trendline (blue) followed by a retest and rejection.
🧭 1. Trend AnalysisLong-Term Trend:From 2022 highs (₹900+), Natural Gas was in a sharp downtrend (blue descending trendline).Downtrend broke in late 2023, initiating a mid-term uptrend within an ascending channel.
Short-Term Trend:Since the ₹405.7 high (early 2025), prices are in a correction phase.Price now testing demand zone near ₹244–₹212.
📈 2. Chart Patterns,Ascending Channel: Price has been moving between parallel green lines since late 2023.Breakdown Risk: Price is testing the lower channel line; breakdown could trigger more downside.Head & Shoulders Possibility: The highs around ₹405–₹358 resemble a left shoulder–head–right shoulder formation, with neckline near ₹249–₹244. A confirmed break below could accelerate selling.
Supply Zone Rejection: Strong selling emerged from ₹358–₹405, marking it as a supply zone.📍
3. Key Technical LevelsLevel (₹) nType the:Significance 405.7
🔺 Major Supply 2025 high, strong rejection point 358.7
Secondary Supplying- Recent swing high before sell-off
249.6–244.7
⚠️ Current Zone Channel support & neckline zone
218.0 🛑 Demand Zone Past consolidation & buying interest
212.0 🛑 Strong Support Historical demand zone floor
209.9
🔻 Critical Support
If broken, opens path to ₹180–₹160⚖ 4. Demand & Supply ZonesDemand Zones:₹218–₹212 (weekly accumulation area)₹180–₹160 (last major base before rally)
Supply Zones:₹358–₹405 (heavy selling area)₹280–₹300 (minor supply if bounce occurs)
5. Possible ScenariosScenario
1 Support Holds:If ₹244–₹212 holds, expect a bounce towards ₹280 and ₹300.A close above ₹300 could re-test ₹358.
Scenario
2 – Breakdown:A close below ₹212 could lead to a quick drop towards ₹180–₹160.
⚠ Disclaimer:
This is for educational purposes only, not trading advice. Futures & commodities are highly volatile; manage risk and consult a registered financial advisor.
This will include chart structure, patterns, demand–supply zones, and precise support/resistance levels based on what I can see on the charts :
🔍Chart OverviewTimeframe: Weekly (1W)Current Price: ₹244.7 (down -5.30%)Price is near an important ascending trendline support (green line) after a strong correction from recent highs. Structure shows earlier breakout above descending trendline (blue) followed by a retest and rejection.
🧭 1. Trend AnalysisLong-Term Trend:From 2022 highs (₹900+), Natural Gas was in a sharp downtrend (blue descending trendline).Downtrend broke in late 2023, initiating a mid-term uptrend within an ascending channel.
Short-Term Trend:Since the ₹405.7 high (early 2025), prices are in a correction phase.Price now testing demand zone near ₹244–₹212.
📈 2. Chart Patterns,Ascending Channel: Price has been moving between parallel green lines since late 2023.Breakdown Risk: Price is testing the lower channel line; breakdown could trigger more downside.Head & Shoulders Possibility: The highs around ₹405–₹358 resemble a left shoulder–head–right shoulder formation, with neckline near ₹249–₹244. A confirmed break below could accelerate selling.
Supply Zone Rejection: Strong selling emerged from ₹358–₹405, marking it as a supply zone.📍
3. Key Technical LevelsLevel (₹) nType the:Significance 405.7
🔺 Major Supply 2025 high, strong rejection point 358.7
Secondary Supplying- Recent swing high before sell-off
249.6–244.7
⚠️ Current Zone Channel support & neckline zone
218.0 🛑 Demand Zone Past consolidation & buying interest
212.0 🛑 Strong Support Historical demand zone floor
209.9
🔻 Critical Support
If broken, opens path to ₹180–₹160⚖ 4. Demand & Supply ZonesDemand Zones:₹218–₹212 (weekly accumulation area)₹180–₹160 (last major base before rally)
Supply Zones:₹358–₹405 (heavy selling area)₹280–₹300 (minor supply if bounce occurs)
5. Possible ScenariosScenario
1 Support Holds:If ₹244–₹212 holds, expect a bounce towards ₹280 and ₹300.A close above ₹300 could re-test ₹358.
Scenario
2 – Breakdown:A close below ₹212 could lead to a quick drop towards ₹180–₹160.
⚠ Disclaimer:
This is for educational purposes only, not trading advice. Futures & commodities are highly volatile; manage risk and consult a registered financial advisor.
免責聲明
這些資訊和出版物並非旨在提供,也不構成TradingView提供或認可的任何形式的財務、投資、交易或其他類型的建議或推薦。請閱讀使用條款以了解更多資訊。