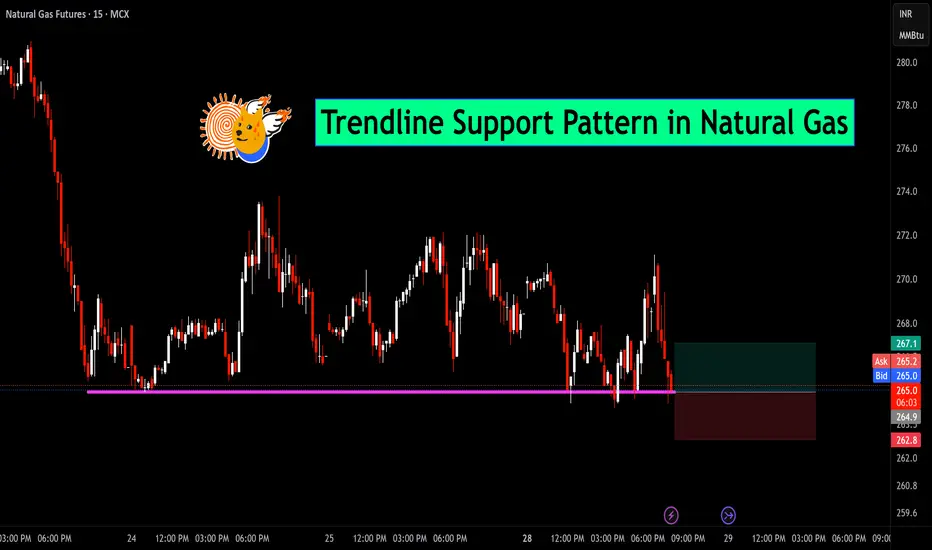
Natural Gas is currently respecting a well-established horizontal trendline support zone around the 264–265 level. As seen in the chart, price has tested this area multiple times, indicating strong demand and buyer interest at this zone.
📉 The recent candles show rejection from the support, suggesting a potential bounce. If this level continues to hold, we may see an upward move toward the 267–270 resistance area.
📌 Trade Idea:
Entry: Near 265.3
Stop-loss: Below 262.8 (structure break)
Target: 267.1 and above for short-term move
🧠 Watch for confirmation with volume or bullish candlestick formations before entering the trade.
Get BTST Toolkit:
Contact below to get access ⬇️
✅Whatsapp: wa.me/919084286797
✅ Telegram: t.me/breakoutinvesting
⭐ Custom Indicator
⭐ BTST Calls
⭐ FNO Trades
⭐ Algo Trading
Contact below to get access ⬇️
✅Whatsapp: wa.me/919084286797
✅ Telegram: t.me/breakoutinvesting
⭐ Custom Indicator
⭐ BTST Calls
⭐ FNO Trades
⭐ Algo Trading
免責聲明
The information and publications are not meant to be, and do not constitute, financial, investment, trading, or other types of advice or recommendations supplied or endorsed by TradingView. Read more in the Terms of Use.