Back in October 2023, NEAR embarked on an incredible bull run lasting 147 days, surging from a low of $0.971 to a high of $9.01—an astounding +828% gain. Following this euphoric phase, the market sentiment shifted dramatically. Over the subsequent 392 days, NEAR retraced to around $2, marking a -78% decline. Now, with the market at a critical juncture, the question remains: when does the madness of the crash end, and can we finally see a reversal?
Harmonic Patterns & Fibonacci Confluence
Chart Pattern Analysis: The XABCD Framework
Using the XABCD pattern tool, we identify the following key points:
Durations:
These durations show remarkable symmetry—with the up-move phases (X-A and A-B) nearly matching in time, and similarly for the correction phases (B-C and C-D). This time symmetry supports the presence of a harmonic structure, and the retracement levels help validate the potential for a reversal.
Fibonacci Implications
While Point D’s retracement at 0.875 is slightly deeper than the classic 0.786 level expected for a Gartley Harmonic, it remains close enough to validate a harmonic correction, especially considering market noise. Additionally, the expansion of BC at 1.212 is close to the 1.27 range, lending further credence to this being a Gartley-type pattern.
Time Factor: Fibonacci Time Extensions & Exhaustion
Fibonacci Time Extensions:
The alignment of these time-based measures with the price retracement (approximately 87.5% retracement of the original move) signals a critical juncture where the bearish phase could soon be over.
Identifying the Support Zone & Long Opportunity
Based on harmonic and Fibonacci analyses, the confluence of key support levels points to a potential bottom:
These levels create a long opportunity window between $1.99 and $1.887. This confluence offers a solid entry region for long positions.
Additionally, other confluence factors include:
High-Probability Trade Setup
Long Entry:
Market Outlook:
Key Takeaways
After decades in the trading arena, one thing is clear—the market often cycles through periods of euphoria and despair before turning a corner. NEAR's confluence of harmonic symmetry, Fibonacci retracement, and time-based exhaustion is almost too aligned to ignore. With a defined long entry window between $1.99 and $1.887, this might be the moment to consider a high-probability long trade. As always, manage your risk diligently and wait for clear confirmation.
Wrapping it up here, happy trading =)
If you found this helpful, leave a like and comment below! Got requests for the next technical analysis? Let me know.
Harmonic Patterns & Fibonacci Confluence
Chart Pattern Analysis: The XABCD Framework
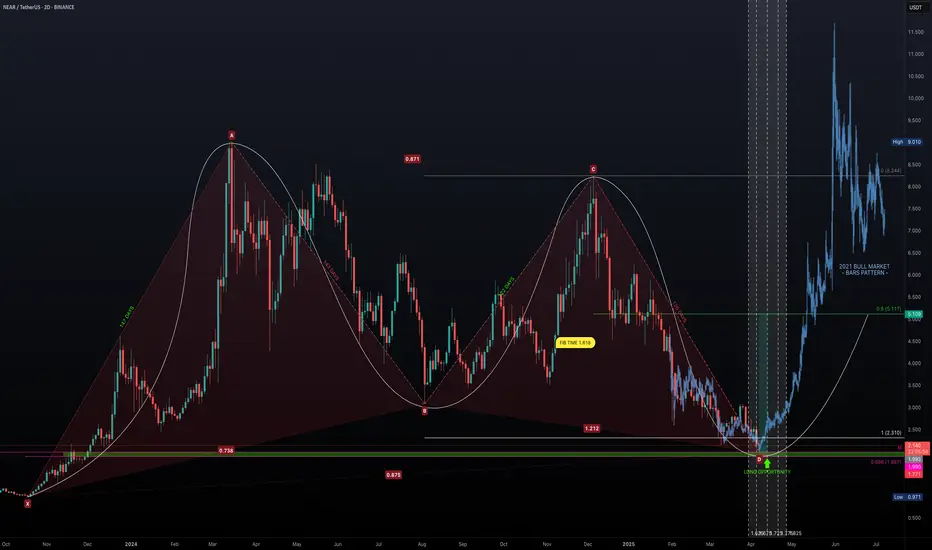
Using the XABCD pattern tool, we identify the following key points:
- Point X: $0.971
- Point A: $9.01
- Point B: $3.076
- Point C: $8.244
- Point D: $1.978
Durations:
- X-A: 147 Days
- A-B: 143 Days
- B-C: 122 Days
- C-D: 126 Days
These durations show remarkable symmetry—with the up-move phases (X-A and A-B) nearly matching in time, and similarly for the correction phases (B-C and C-D). This time symmetry supports the presence of a harmonic structure, and the retracement levels help validate the potential for a reversal.
Fibonacci Implications
- Fib Retracement of XA: Point B is at 0.738
- Fib Retracement of AB: Point C sits at 0.871
- Fib Retracement of BC: Point D lands at 0.875
- Fib Extension of BC: Point D is at 1.212
While Point D’s retracement at 0.875 is slightly deeper than the classic 0.786 level expected for a Gartley Harmonic, it remains close enough to validate a harmonic correction, especially considering market noise. Additionally, the expansion of BC at 1.212 is close to the 1.27 range, lending further credence to this being a Gartley-type pattern.
Time Factor: Fibonacci Time Extensions & Exhaustion
- 147-day Bull Run: NEAR rose from $0.971 to $9.01 in 147 days.
- 392-day Bearish Correction: Since hitting $9.01, the price has retraced for 392 days.
Fibonacci Time Extensions:
- 1.618 multiplier: 147 × 1.618 ≈ 238 days. A Classic "golden ratio" reversal target. This period coincided with a +135% surge in November.
- 2.618 multiplier: 147 × 2.618 ≈ 385 days. High-probability exhaustion point. This is nearly equal to the current 392 days, suggesting that time-based exhaustion may be imminent.
The alignment of these time-based measures with the price retracement (approximately 87.5% retracement of the original move) signals a critical juncture where the bearish phase could soon be over.
Identifying the Support Zone & Long Opportunity
Based on harmonic and Fibonacci analyses, the confluence of key support levels points to a potential bottom:
- Harmonic Point D: Trading near $2.
- Monthly Level: $1.99 acts as a strong support benchmark.
- Fibonacci Retracement (0.886): at $1.887.
These levels create a long opportunity window between $1.99 and $1.887. This confluence offers a solid entry region for long positions.
Additionally, other confluence factors include:
- Fibonacci time extension at the 2.618 level (around 385 days) aligning with the current duration of the bearish phase.
- The symmetry of the XABCD pattern adds to the reliability of the support structure.
High-Probability Trade Setup
Long Entry:
- Entry Zone: Accumulate positions in the $1.99 to $1.887 range.
- Target: Aim for the 0.5 Fibonacci retracement level of the bull run, approximately $5.00, which represents a potential +150% gain from current levels.
- Risk-to-Reward (R:R): With the setup targeting a substantial rebound, the risk-reward ratio is very attractive, particularly if entry is taken in the defined confluence zone.
Market Outlook:
- Current Sentiment: NEAR is in a significant downtrend, evidenced by a dramatic -78% retracement after an explosive bull run.
- Reversal Indicators: The harmonic pattern, Fibonacci retracements, and time exhaustion (392 days approaching the 2.618 extension) all point towards a possible bottom formation in the coming month, particularly during April.
- Potential Reversal: If NEAR holds within the $1.99 to $1.887 window, a reversal back towards $5.00 appears plausible, echoing the conditions seen at previous market cycle reversals.
Key Takeaways
- Historic Run & Severe Correction: NEAR surged over +828% in 147 days only to retrace -78% over the following 392 days.
- Harmonic Confluence: The XABCD pattern and Fibonacci levels create a compelling argument for a turnaround.
- Time & Price Alignment: Fibonacci time extension around 385 days combined with an 87.5% price retracement suggests market exhaustion.
- Solid Long Entry Zone: The support between $1.99 and $1.887 offers an attractive risk entry point with the potential to target a move back up to $5.00.
After decades in the trading arena, one thing is clear—the market often cycles through periods of euphoria and despair before turning a corner. NEAR's confluence of harmonic symmetry, Fibonacci retracement, and time-based exhaustion is almost too aligned to ignore. With a defined long entry window between $1.99 and $1.887, this might be the moment to consider a high-probability long trade. As always, manage your risk diligently and wait for clear confirmation.
Wrapping it up here, happy trading =)
If you found this helpful, leave a like and comment below! Got requests for the next technical analysis? Let me know.
交易進行
NEAR continues to show signs of strength after reaching the 0.886 Fibonacci retracement level at $1.887, marking a completion of a 5-wave corrective structure. Following this deep retracement, we’ve seen a notable spike in volume, suggesting that accumulation is underway, especially as price moved back toward a key previous high.
📌 Possible Inverse Head & Shoulders in Formation
What makes this setup even more compelling is the emerging inverse head and shoulders pattern:
Left Shoulder: Volume spike at $2, aligning with the monthly support level—this area served as the initial base of demand.
Head: Defined at the low of $1.821, aligning with the 0.886 Fib—a deep but common reversal zone in harmonic structures.
Right Shoulder: Currently in progress, with price consolidating near the $2 support zone.
🔍 Trade Setup Details
This structure opens up a high-probability long opportunity:
Entry Zone: Between $2.00 and $1.90, ideal for laddering entries while the right shoulder forms.
Stop Loss: Just below the head, at $1.82—logical invalidation level.
Neckline Resistance: $2.15 – A decisive break and retest of this level would validate the inverse H&S and confirm trend reversal.
🎯 Price Targets (Using Fibonacci Retracement from $3.093 to $1.821)
TP1 – $2.30: 0.382 Fibonacci retracement – aligns with the anchored VWAP from the $3.093 high, creating a significant resistance.
TP2 – $2.60: 0.618 retracement – a classic reversal target for corrective bounces and potential mid-term top.
📊 Risk-to-Reward Breakdown
Target 1 (TP1 – $2.30): R:R ≈ 2.5:1
Target 2 (TP2 – $2.60): R:R ≈ 4.5:1
These are excellent risk-reward ratios, especially considering the potential confirmation from the pattern's neckline breakout.
💡 Optional Trade Idea
More conservative traders may choose to wait for confirmation of the pattern by entering after a breakout and retest of the $2.15 neckline, aiming for the same upside targets with added confidence, albeit with a slightly different entry point and adjusted stop loss.
This setup checks all the boxes:
High-volume reaction from a fib-rich reversal zone.
Classic reversal pattern forming.
Clear support and resistance levels defined by price action and volume.
Optional entry strategies depending on risk tolerance and trading style.
🏆 Mastering Fibonacci for precision trading
🔹 Sharing high-probability trade setups
⚡ Unlock the power of technical analysis!
🔹 Sharing high-probability trade setups
⚡ Unlock the power of technical analysis!
相關出版品
免責聲明
這些資訊和出版物並不意味著也不構成TradingView提供或認可的金融、投資、交易或其他類型的意見或建議。請在使用條款閱讀更多資訊。
🏆 Mastering Fibonacci for precision trading
🔹 Sharing high-probability trade setups
⚡ Unlock the power of technical analysis!
🔹 Sharing high-probability trade setups
⚡ Unlock the power of technical analysis!
相關出版品
免責聲明
這些資訊和出版物並不意味著也不構成TradingView提供或認可的金融、投資、交易或其他類型的意見或建議。請在使用條款閱讀更多資訊。