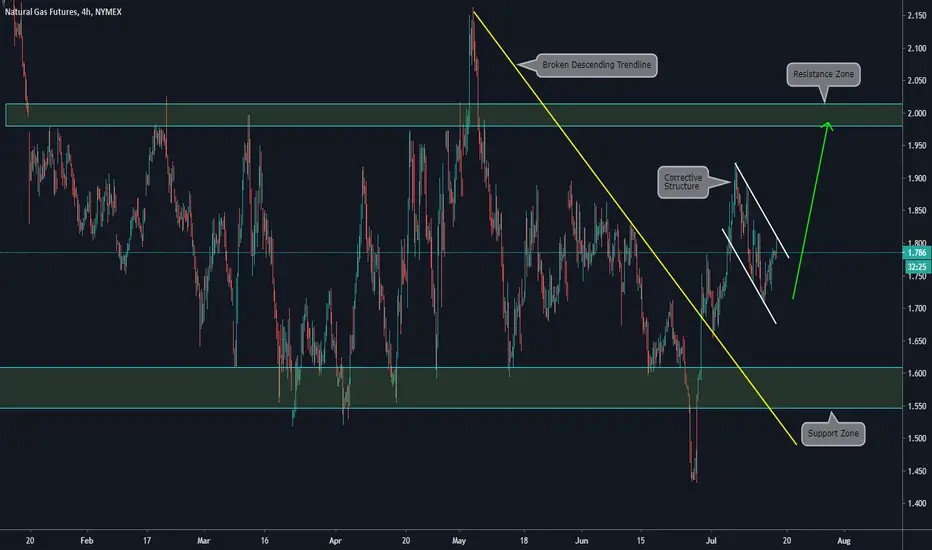
Main items we can see on the chart:
a) The price is inside a clear range, between a support and a resistance zone
b) Inside the range, we can see a broken descending trendline after the price bounced on the support zone
c) After the breakout, we can see a corrective Structure
d) If the Corrective Structure is broken we expect a continuation of the bullish movement, towards the next resistance zone
免責聲明
這些資訊和出版物並非旨在提供,也不構成TradingView提供或認可的任何形式的財務、投資、交易或其他類型的建議或推薦。請閱讀使用條款以了解更多資訊。
免責聲明
這些資訊和出版物並非旨在提供,也不構成TradingView提供或認可的任何形式的財務、投資、交易或其他類型的建議或推薦。請閱讀使用條款以了解更多資訊。