📊 Chart Structure Overview
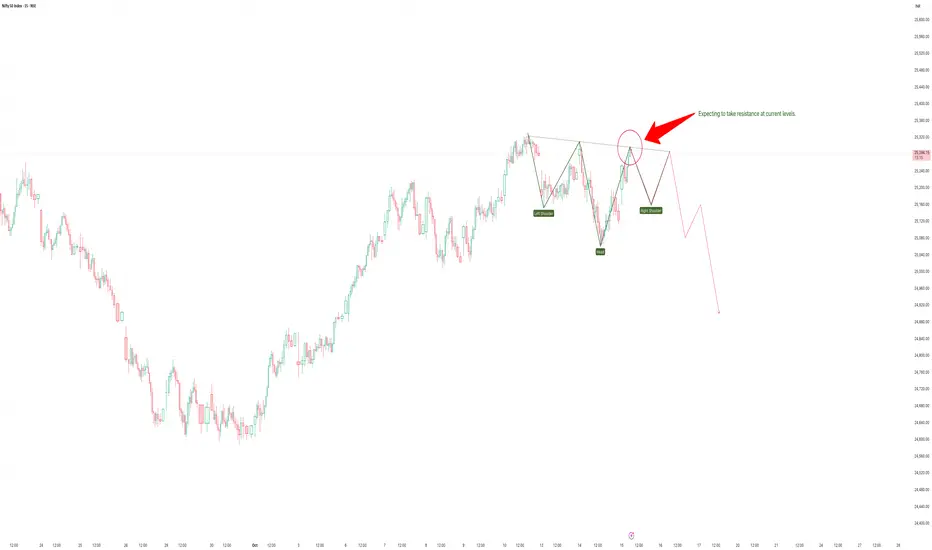
The chart clearly displays a Head and Shoulders (H&S) formation — a bearish reversal pattern developing after a strong uptrend.
Left Shoulder: Around 25,350 region
Head: Formed near 25,475
Right Shoulder: Currently forming near 25,330–25,350
Neckline: Roughly around 25,120
You’ve correctly marked “Expecting to take resistance at current levels”, which aligns with the right shoulder zone, a classical point for potential downside reversal.
⚙️ Pattern Implications
Scenario 1 – Breakdown Confirmation (Bearish)
A decisive break below the neckline (≈25,120) with volume confirmation would validate the pattern.
Projected target:
Height of the head-to-neckline ≈ 350 points →
Breakdown target zone = 25,120 – 350 = 24,770
→ Immediate supports: 24,950 → 24,770 → 24,680
Scenario 2 – Rejection Fails (Bullish Reversal Invalidated)
If Nifty closes above 25,380–25,400 with momentum, the right shoulder fails.
That could lead to short covering up to 25,500–25,550 before re-evaluating the bearish bias.
🔍 Volume & Momentum
Volume shows diminishing strength during the recent right shoulder rise — typical in a distribution phase.
RSI (if plotted) would likely show bearish divergence — price making lower high vs. RSI making higher high.
This supports your expectation of rejection near current resistance.
🧭 Short-Term View (Next 1–3 Sessions)
Bias Level Action
Bearish below 25,120 Breakdown confirmation → expect 24,950 → 24,770
Neutral zone 25,120–25,350 Wait for candle confirmation near neckline
Bullish reversal only above 25,400 Pattern invalidation; potential push to 25,500–25,550
🧠 Conclusion
The Head & Shoulders pattern near the top suggests distribution and possible short-term correction.
Expect pullback rejection near 25,330–25,350 and a move toward 25,000–24,800 if neckline breaks.
Keep stops above 25,400 for short setups.
Summary:
✅ Pattern: Head & Shoulders
⚠️ Trigger Point: Breakdown below 25,120
🎯 Target Zone: 24,950–24,770
🔒 Stop-loss (for shorts): 25,400
Disclaimer:
This analysis is for educational and technical research purposes only, not financial advice. Market movements are subject to volatility; always confirm with your own entry and risk parameters before trading.
免責聲明
這些資訊和出版物並不意味著也不構成TradingView提供或認可的金融、投資、交易或其他類型的意見或建議。請在使用條款閱讀更多資訊。
免責聲明
這些資訊和出版物並不意味著也不構成TradingView提供或認可的金融、投資、交易或其他類型的意見或建議。請在使用條款閱讀更多資訊。