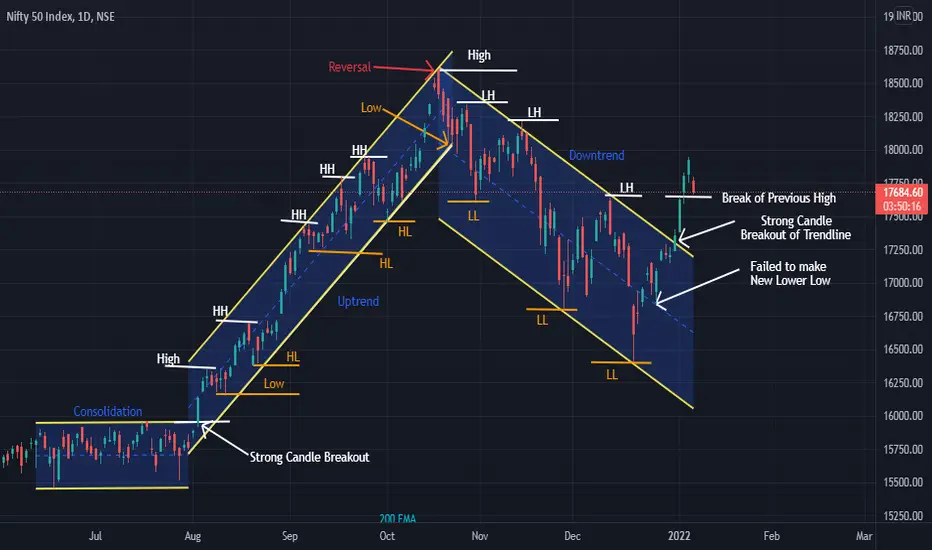
Beautiful Example of Price Action shown by Nifty on Daily chart.
First you can see Consolidation before BULL run.
When BULL run started you can see HH & HL forming in Uptrend Channel
once it reaches the Top it showed Reversal with Continuous red candles
After that a Downtrend with HL & LL forming
and it broke the channel upside - Showing Breakout of Resistance Line
Understanding Simple Price Action in one Chart Shown by Nifty
please do correlate by yourself also on charts. This is for educational and paper trading purpose only. Please consult your financial advisor before invest
免責聲明
這些資訊和出版物並不意味著也不構成TradingView提供或認可的金融、投資、交易或其他類型的意見或建議。請在使用條款閱讀更多資訊。
免責聲明
這些資訊和出版物並不意味著也不構成TradingView提供或認可的金融、投資、交易或其他類型的意見或建議。請在使用條款閱讀更多資訊。