Hi Everyone !
Welcome to monthly projection for nifty Fut.
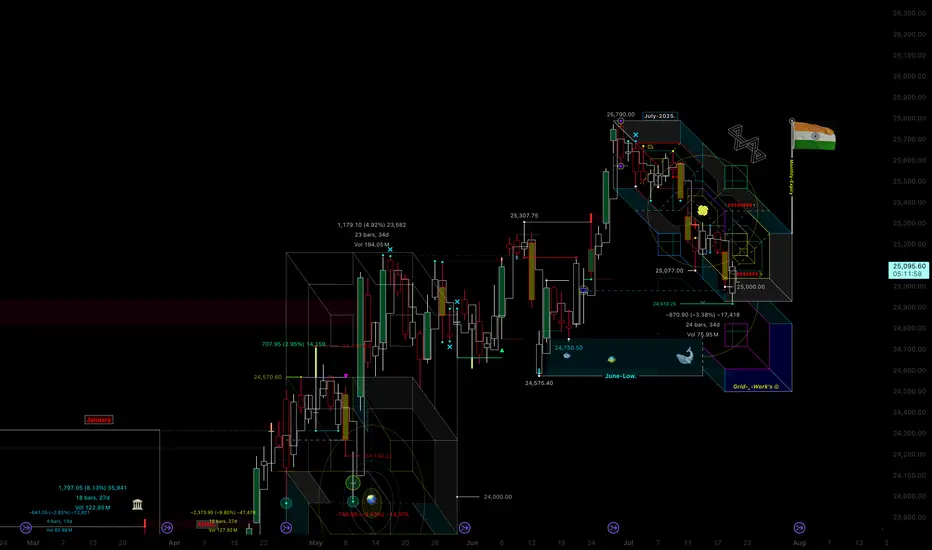
this is an example how we can come up with this kind of box, where it gives you the
levels and shows you the angle and also is shows you where the big stop zones are
and how we cam time the market for various kinds of trades
also it shows you the gaps/imbalances/speed zones/cave fill/repair zones and so on.....
Directional, non-directional -spreads-intraday/longterm
also this technology not only shows you where market is going
but it also shows you how it will go there so you can time it with various
execution strategies
hope you like it
power to the people !
Grid-_-Work's
Welcome to monthly projection for nifty Fut.
this is an example how we can come up with this kind of box, where it gives you the
levels and shows you the angle and also is shows you where the big stop zones are
and how we cam time the market for various kinds of trades
also it shows you the gaps/imbalances/speed zones/cave fill/repair zones and so on.....
Directional, non-directional -spreads-intraday/longterm
also this technology not only shows you where market is going
but it also shows you how it will go there so you can time it with various
execution strategies
hope you like it
power to the people !
Grid-_-Work's
免責聲明
這些資訊和出版物並非旨在提供,也不構成TradingView提供或認可的任何形式的財務、投資、交易或其他類型的建議或推薦。請閱讀使用條款以了解更多資訊。
免責聲明
這些資訊和出版物並非旨在提供,也不構成TradingView提供或認可的任何形式的財務、投資、交易或其他類型的建議或推薦。請閱讀使用條款以了解更多資訊。