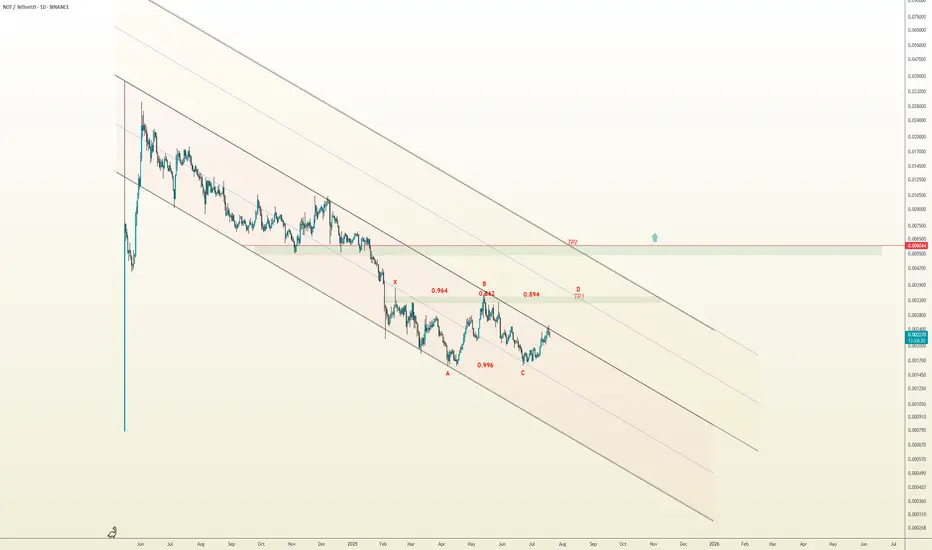
🦋 Bullish Butterfly Pattern Forming | NOTUSDT Analysis
A potential Bullish Butterfly is unfolding on NOTUSDT:
X to A: initial decline
A to B: ~94.3% retracement
B to C: higher low at ~99.6%
C to D: projected bullish leg toward 0.00327 (127.8% Fib), aligning with midline of the yellow descending channel
The price is currently testing the top of the red descending channel.
If bullish momentum holds and this upper boundary breaks, we anticipate a continuation toward point D, and potentially toward 0.006044, the upper yellow channel — a highly critical resistance. A breakout and close above this level may trigger the beginning of a major bullish trend.
🔸 Risk Management:
• Consider partial profit-taking near the midline of the yellow channel
• Trail stop-loss as the price nears point D
• Use only 1% of capital per position
⚠️ Key Note:
• If price breaks below point C, this bullish butterfly setup becomes invalid
交易進行
免責聲明
這些資訊和出版物並不意味著也不構成TradingView提供或認可的金融、投資、交易或其他類型的意見或建議。請在使用條款閱讀更多資訊。