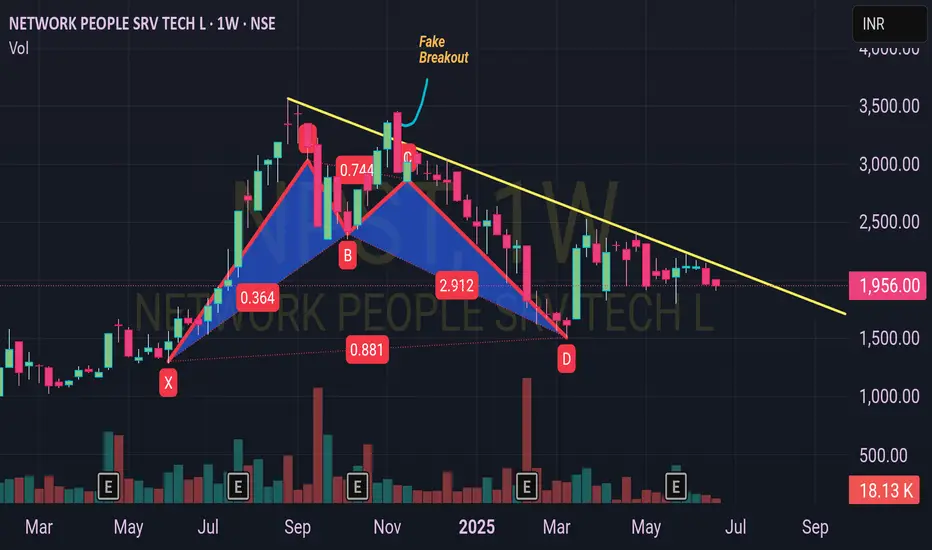
The weekly price chart of Network People Services Technologies Limited (NPST) listed on the National Stock Exchange (NSE) offers an intriguing look at its recent market performance. As of June 25, 2025, the stock has shown a notable rebound, currently trading at INR 1,958.00 with a modest gain of +29.70 (+1.54%) and a trading volume of 18.05K. This resurgence comes after the formation of an "M" pattern, a classic technical analysis formation often associated with a potential reversal following a period of consolidation or decline. The chart, published by stocktechbot on TradingView, highlights this pattern, suggesting that investors may be witnessing a shift in momentum.
A closer examination of the chart reveals the "M" pattern's key points, marked as A, B, C, and D. The pattern began with a peak at A (0.741), followed by a dip to B (0.364), a rise to C (2.912), and a subsequent decline to D (0.881). This double-top formation, characteristic of the "M" or double top pattern, typically signals a bearish reversal. However, the recent price action shows the stock breaking above the neckline, labeled as a "Fake Breakout" on the chart, indicating that the anticipated downward move may have been invalidated. This breakout suggests a potential shift to bullish sentiment, supported by the stock's current position above the trend line drawn on the weekly timeframe.
The trend line, a critical tool in technical analysis, has served as a dynamic support level for NPST over the observed period. After hovering near this line, the stock appears to be rebounding, which could indicate the start of an upward trend. The chart’s annotations, including the yellow trend line sloping downward from the peak, align with the price action as it tests and holds above this level. This rebound is a promising sign for traders, as it suggests that buying interest may be increasing, potentially driving the price toward higher resistance levels in the future.
Volume analysis further supports this potential bullish scenario. The chart shows a noticeable increase in volume during the breakout phase, with spikes corresponding to the price movements around points A, B, and C. This heightened activity often accompanies significant price changes and can be interpreted as confirmation of the breakout’s validity. As of the latest data, the trading volume of 18.05K aligns with the stock’s upward movement, reinforcing the possibility that NPST is gaining traction among investors.
In conclusion, the weekly chart of NPST presents a compelling case for a rebound following the "M" pattern, with the stock currently stabilizing above the trend line. While past performance is not a guaranteed predictor of future results, the combination of the breakout, increased volume, and price action suggests a potential shift in market sentiment. Investors and traders should continue to monitor key support and resistance levels, such as the trend line at INR 1,958.00 and the previous high near INR 2,912.00, to gauge the stock’s next move in this evolving technical landscape.
免責聲明
這些資訊和出版物並不意味著也不構成TradingView提供或認可的金融、投資、交易或其他類型的意見或建議。請在使用條款閱讀更多資訊。
免責聲明
這些資訊和出版物並不意味著也不構成TradingView提供或認可的金融、投資、交易或其他類型的意見或建議。請在使用條款閱讀更多資訊。