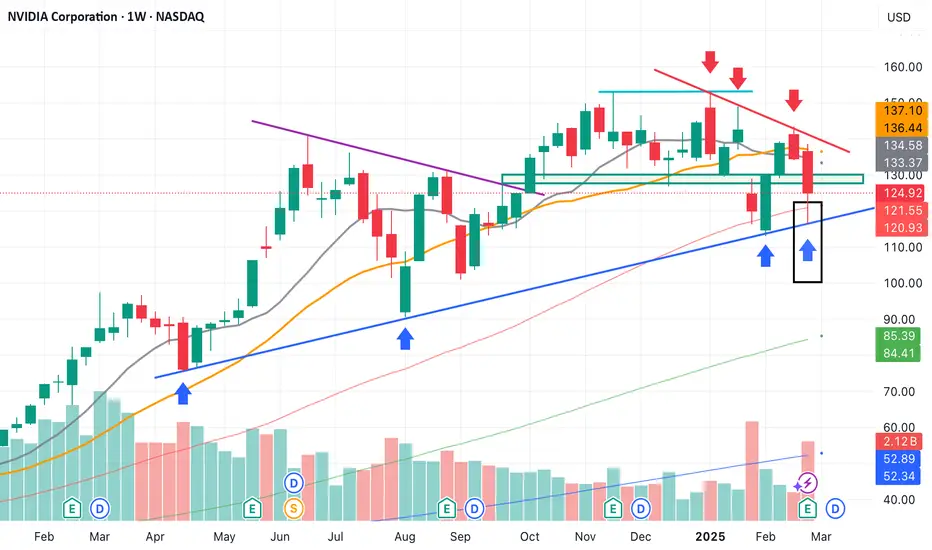
The price bounces for the fourth time on the support indicated by the blue trendline.
The chart is open to different interpretations because at the top we have a possible double top with the blue line, but at the bottom, we have strong support that continues to hold.
Personally, I have seen this tech selloff as an opportunity to accumulate. I think the panic created was meant to make small investors sell, increasing the shares available on the market in anticipation of the next bullish cycle.
For greater security, wait for confirmation from the breakout of the red trendline, indicating the start of the upward trend.
Of course, a break of the blue support means the start of a strong decline.
註釋
I think price will probably go down to the red rectangle免責聲明
這些資訊和出版物並不意味著也不構成TradingView提供或認可的金融、投資、交易或其他類型的意見或建議。請在使用條款閱讀更多資訊。