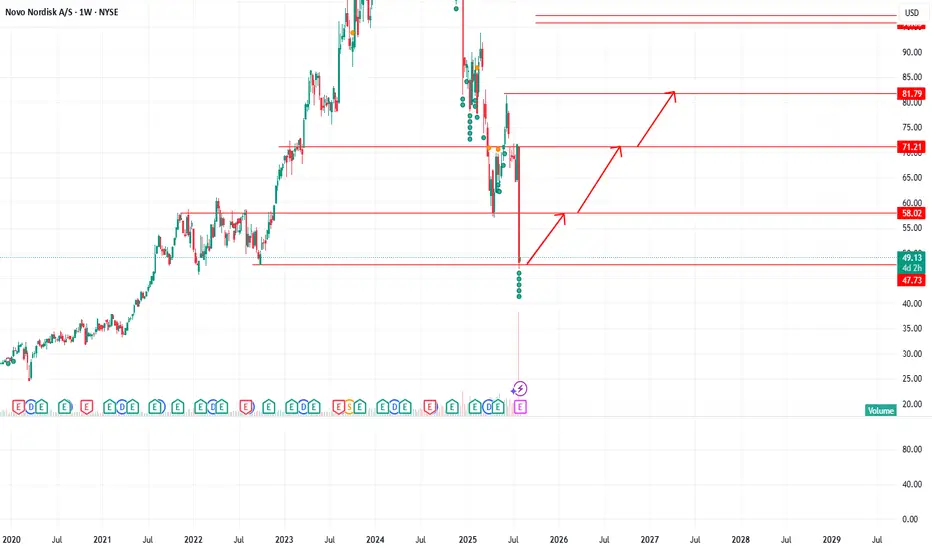
Novo Nordisk (NVO) recently saw a sharp drop with heavy volume, signaling strong selling pressure. The chart shows a potential recovery path if the stock holds support near $47.
🔄 Possible rebound levels:
First target: $58
Mid target: $71
Final target: $82
📊 Options flow shows strong call activity (bullish bets), with a low put/call ratio, suggesting some traders expect a bounce. However, momentum is still weak, and if $47 fails, further downside toward $36 or lower is possible.
免責聲明
這些資訊和出版物並非旨在提供,也不構成TradingView提供或認可的任何形式的財務、投資、交易或其他類型的建議或推薦。請閱讀使用條款以了解更多資訊。
免責聲明
這些資訊和出版物並非旨在提供,也不構成TradingView提供或認可的任何形式的財務、投資、交易或其他類型的建議或推薦。請閱讀使用條款以了解更多資訊。