Looking back:
NZDCAD was on my radar 2 weeks ago since I saw 3 weekly bearish pin bar candles on 3, 10, 17 Dec 2018 reacted with long-term down trendline since 7th Nov 2016. I was waiting for a price pattern since then. I already went short right after seeing bearish candle on 2nd Jan 2019
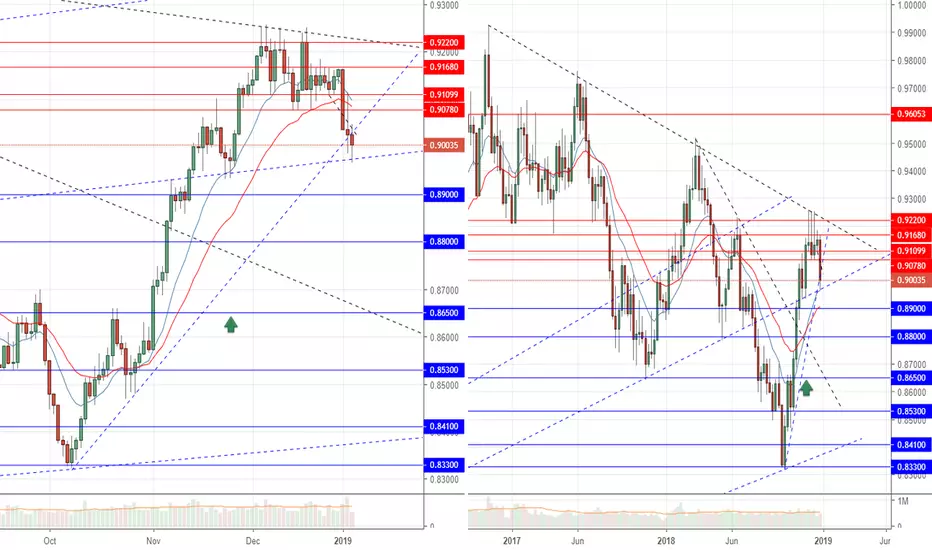
Weekly Chart:
A bearish candle
Daily Chart:
Friday closed with a bearish candle, but we saw the reaction of price with the old long-term trend line since Jan 2009
Watch out:
1. There might be a retest zone 0.907
2. Zone around 0.88-0.89 might be the 1st support
3. Zone around 0.853-0.865 might be stronger support
Action:
Keep holding the short position
NZDCAD was on my radar 2 weeks ago since I saw 3 weekly bearish pin bar candles on 3, 10, 17 Dec 2018 reacted with long-term down trendline since 7th Nov 2016. I was waiting for a price pattern since then. I already went short right after seeing bearish candle on 2nd Jan 2019
Weekly Chart:
A bearish candle
Daily Chart:
Friday closed with a bearish candle, but we saw the reaction of price with the old long-term trend line since Jan 2009
Watch out:
1. There might be a retest zone 0.907
2. Zone around 0.88-0.89 might be the 1st support
3. Zone around 0.853-0.865 might be stronger support
Action:
Keep holding the short position
免責聲明
這些資訊和出版物並不意味著也不構成TradingView提供或認可的金融、投資、交易或其他類型的意見或建議。請在使用條款閱讀更多資訊。
免責聲明
這些資訊和出版物並不意味著也不構成TradingView提供或認可的金融、投資、交易或其他類型的意見或建議。請在使用條款閱讀更多資訊。