Bullish Reversal in Play – ONDO/USDT Weekly Chart
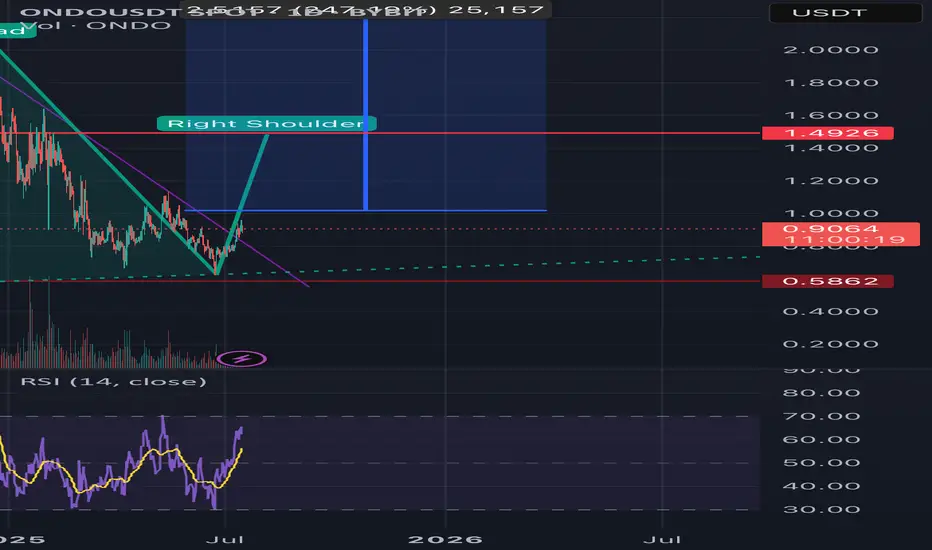
A clear Inverse Head and Shoulders pattern is forming on the weekly timeframe.
Price is currently breaking out of the neckline with strong momentum.
🔹 Left Shoulder: Formed with consistent volume support
🔹 Head: Deep correction followed by strong recovery
🔹 Right Shoulder: Higher low formation with bullish pressure
📈 Potential Target: $2.51 (+247%)
🛡️ Support Zone: ~$0.58
If this breakout confirms with weekly close above the neckline (~$0.90–$1.00),
we could be seeing the start of a major bull wave.
#ONDO #CryptoAnalysis #InverseHeadAndShoulders #Altseason #Breakout
免責聲明
這些資訊和出版物並不意味著也不構成TradingView提供或認可的金融、投資、交易或其他類型的意見或建議。請在使用條款閱讀更多資訊。
免責聲明
這些資訊和出版物並不意味著也不構成TradingView提供或認可的金融、投資、交易或其他類型的意見或建議。請在使用條款閱讀更多資訊。