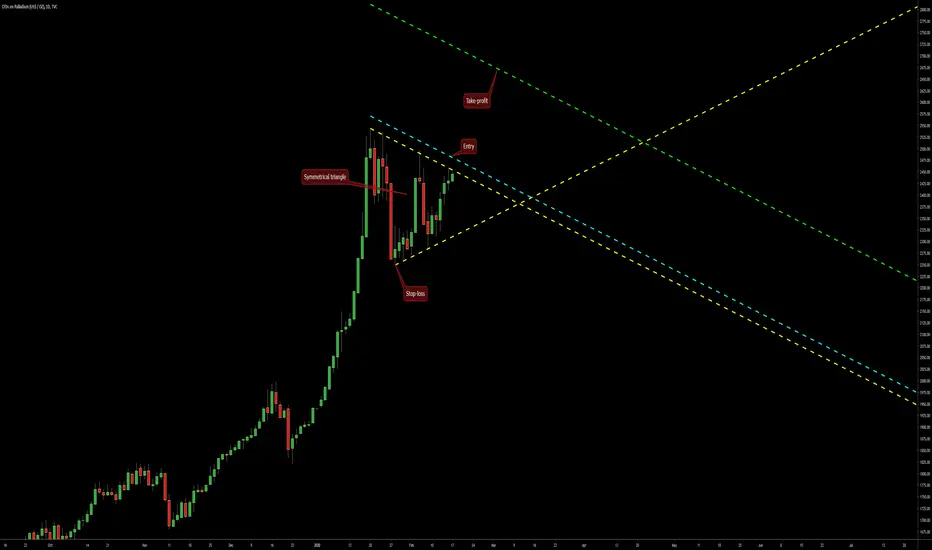
The symmetrical triangle on this daily chart of Palladium CFD offers an upside breakout trading opportunity. The triangle's borders are drawn using the yellow lines. My potential entry level will be at the cyan line. My potential take-profit level will be at the green line. I will use the low of the triangle's base as my stop-loss level (2249.0).
免責聲明
The information and publications are not meant to be, and do not constitute, financial, investment, trading, or other types of advice or recommendations supplied or endorsed by TradingView. Read more in the Terms of Use.
免責聲明
The information and publications are not meant to be, and do not constitute, financial, investment, trading, or other types of advice or recommendations supplied or endorsed by TradingView. Read more in the Terms of Use.