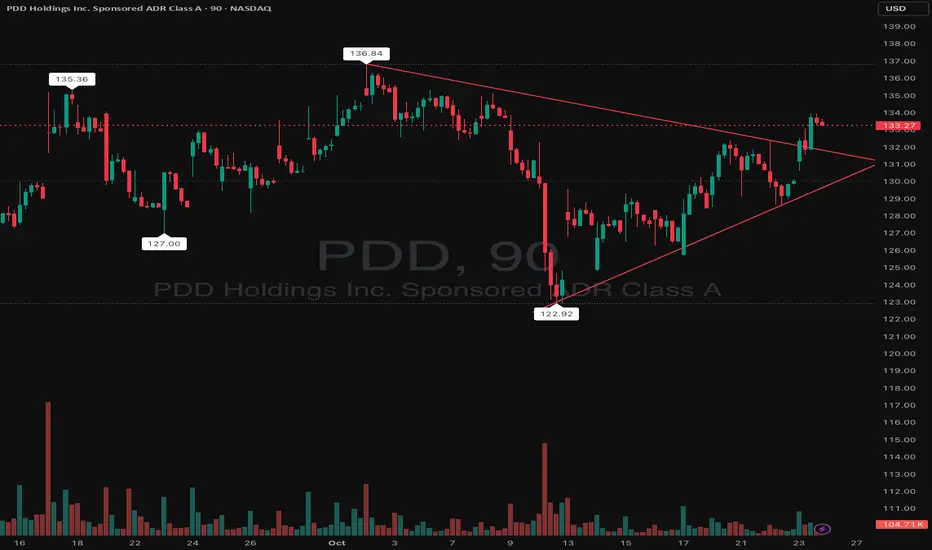
PDD Holdings (PDD) is trading within a symmetrical triangle pattern on the 90-minute chart, showing consolidation after recent volatility. The stock has been forming higher lows from $122.92 and lower highs from $136.84, tightening into a decision zone.
Price is currently around $133.27, sitting right at the upper trendline — signaling a potential breakout attempt. However, confirmation requires a clean move above $134.50–$135 with rising volume.
If buyers take control, the measured breakout target points toward $140–$142. Conversely, failure to hold $130 support may lead to a retest of $127 or the $122.90 swing low.
Support & Resistance Levels:
Support: $131.00 → $128.00 → $122.90
Resistance: $134.50 → $136.80 → $140.00
Strike Play Idea (Options/Directional):
Bullish Play:
Entry: Above $135.00 confirmation
Target: $140–$142
Stop: Below $131
Options Idea: $140 Call (2–3 weeks out) if breakout holds above $135
免責聲明
這些資訊和出版物並不意味著也不構成TradingView提供或認可的金融、投資、交易或其他類型的意見或建議。請在使用條款閱讀更多資訊。
免責聲明
這些資訊和出版物並不意味著也不構成TradingView提供或認可的金融、投資、交易或其他類型的意見或建議。請在使用條款閱讀更多資訊。