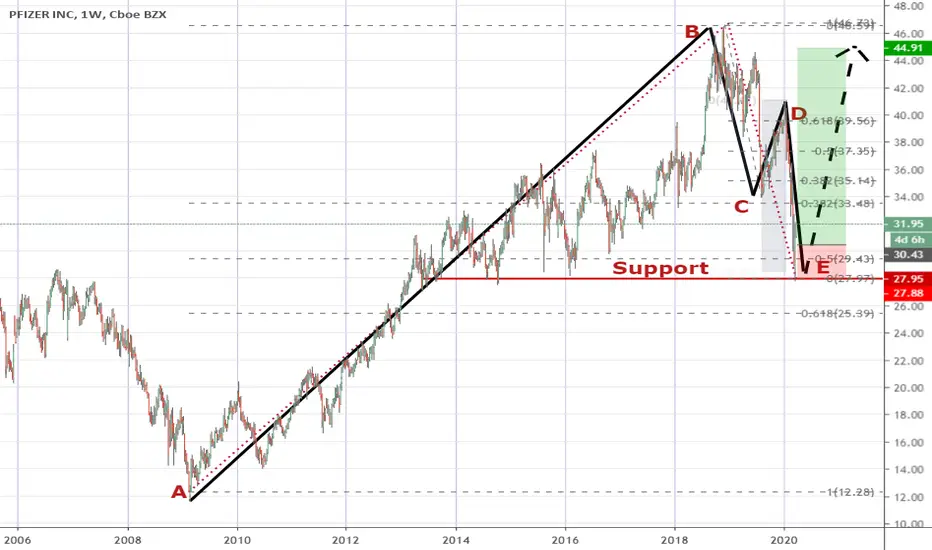
I am excited to see a bullish fibonacci 2-step pattern on PFE's weekly chart!
A bullish 2-step pattern will form a lower high and a lower low after a prior uptrend but despite this, it is not the begining of a bigger downtrend but instead the odds are good that the uptrend then resumes from here. The 2 step pattern (forming a lower high and then a lower low) has to conform to certain fibonacci ratios in order to be valid (google "fibonacci 2-step pattern) if u want to learn more about this pattern). For this PFE chart, BC = DE (100% projection), and CD = 50% retracement of BC.
I am going long with the assumption that the bigger up swing is now resuming although I will still be managing my positions up by scaling out incremetally on the way up.
Disclaimer: This is just my own analysis and opinion for discussion and is not a trade advice. Kindly do your own due diligence and trade according to your own risk tolerance. Thank you!
免責聲明
這些資訊和出版物並不意味著也不構成TradingView提供或認可的金融、投資、交易或其他類型的意見或建議。請在使用條款閱讀更多資訊。