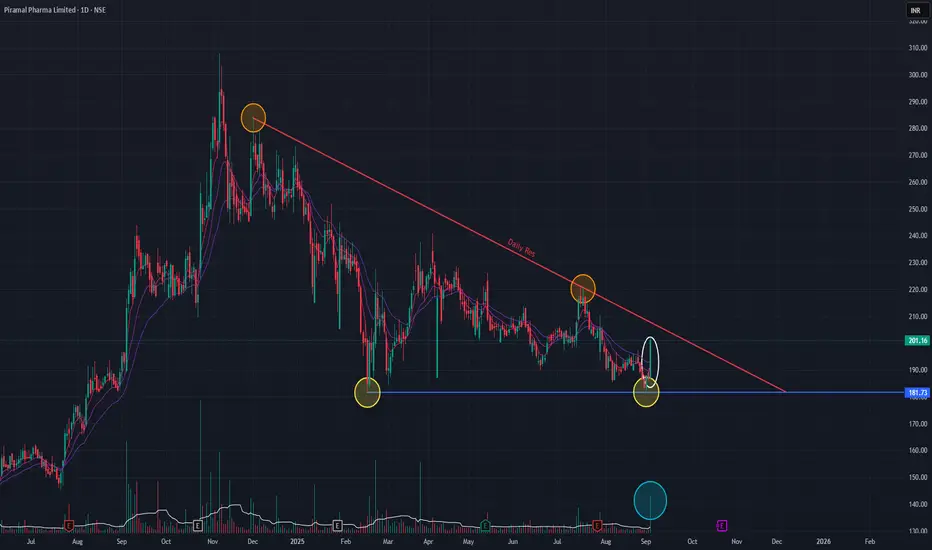
Piramal Pharma, has formed a Double-Bottom chart pattern, indicating Bullish reversal. With today's bullish candle the volume has also spiked. We should watch out for the price action in the coming days. As indicated in the chart, resistance trendline is respected as well as the support trendline. If the stock has to move up, then it has to breach the resistance trendline.
Let's keep a watch on it.
Let's keep a watch on it.
Disclaimer: This analysis is my personal view & for educational purposes only. They shall not be construed as trade or investment advice. Before making any financial decision, it is imperative that you consult with a qualified financial professional.
免責聲明
這些資訊和出版物並非旨在提供,也不構成TradingView提供或認可的任何形式的財務、投資、交易或其他類型的建議或推薦。請閱讀使用條款以了解更多資訊。