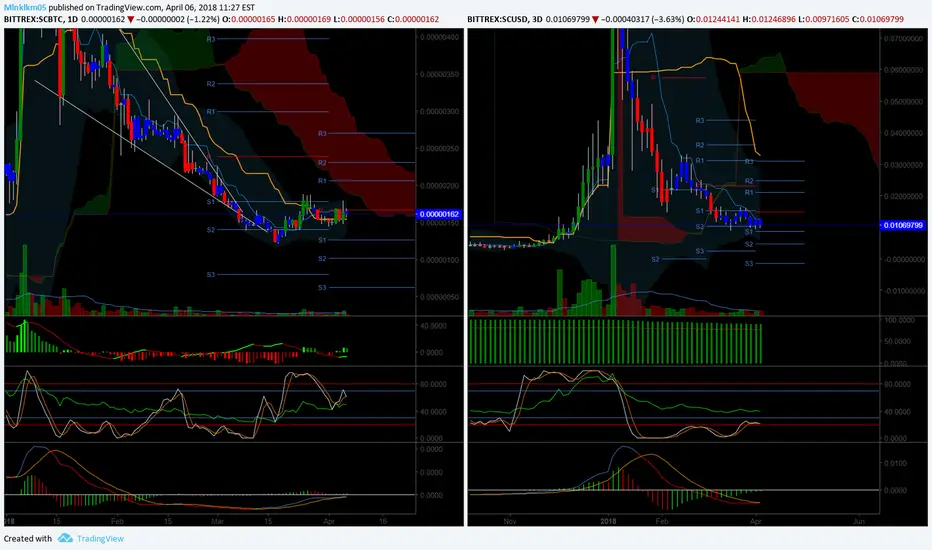
after such a long time daily is bullish as u see left side, try to hodl
and see how tenkan crossover kijun and price above both of it
also daily dm+ above dm- a good sign too
right side 3d chart
blue lines are support and resistance lines if needed s1,s2 support and r1,r2 resistance fibonacci levels
and see how tenkan crossover kijun and price above both of it
also daily dm+ above dm- a good sign too
right side 3d chart
blue lines are support and resistance lines if needed s1,s2 support and r1,r2 resistance fibonacci levels
免責聲明
這些資訊和出版物並不意味著也不構成TradingView提供或認可的金融、投資、交易或其他類型的意見或建議。請在使用條款閱讀更多資訊。