Date: July 7, 2025
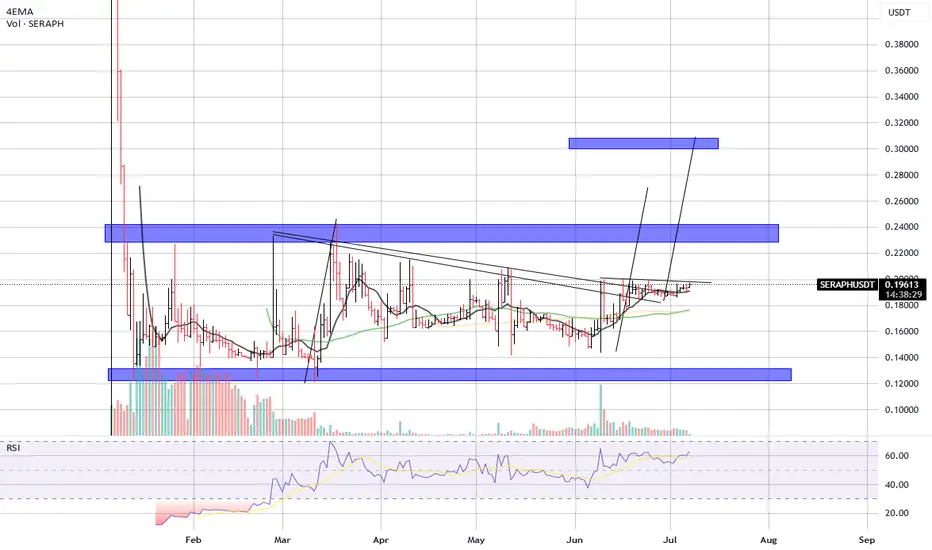
SERAPH/USDT is showing signs of a potential breakout after weeks of accumulation. The price is coiling tightly just below a key descending trendline resistance, forming a bullish structure with higher lows. Volume remains steady, and momentum indicators point toward increasing strength.
📊 Technical Overview:
Current Price: $0.19643
EMA Levels: Price is now above the 4EMA and other moving averages, signaling short-term bullish control.
Structure: The chart is forming a breakout pattern from a descending triangle, with a tight consolidation near the resistance.
📉 Support Zones:
$0.18000 (minor support)
$0.14000–$0.15000 (major historical demand zone)
📈 Resistance/Target Zones:
First Resistance Zone: ~$0.23000–$0.24500
Main Target: ~$0.30000 (measured move and major supply zone)
📊 Indicators:
RSI: 62.81 – approaching bullish breakout territory but still below overbought, suggesting room to rally
Volume: Slight uptick on green candles – suggests growing interest from buyers
🔍 Chart Structure:
Price broke above the descending trendline once but failed to hold.
Since then, it has formed a clean base with steady higher lows and is now retesting the upper boundary.
Multiple tests of resistance increase the likelihood of a breakout soon.
🎯 Upside Projections:
Short-Term Target: $0.23000–$0.24500
Mid-Term Target: $0.30000+
These projections align with the height of the pattern and previous supply areas.
📉 Invalidation:
Breakdown below $0.18000 would delay the bullish setup.
A move below $0.14000 would invalidate the structure and suggest weakness.
免責聲明
這些資訊和出版物並不意味著也不構成TradingView提供或認可的金融、投資、交易或其他類型的意見或建議。請在使用條款閱讀更多資訊。
免責聲明
這些資訊和出版物並不意味著也不構成TradingView提供或認可的金融、投資、交易或其他類型的意見或建議。請在使用條款閱讀更多資訊。