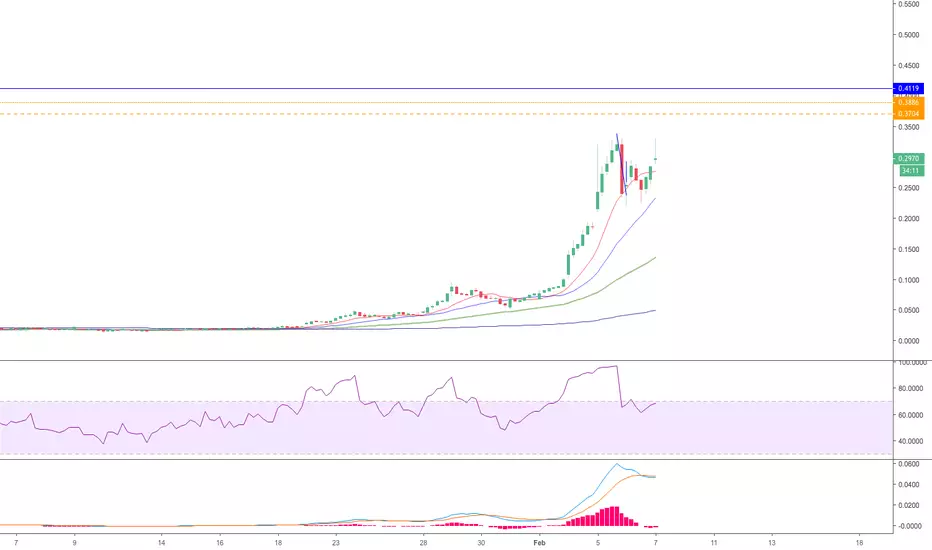
If SHMP can break to new highs, then I will be looking for a reaction at the yellow and blue horizontal lines.
My EW counts have the recent high as either the 3rd or 5th Wave.
Let's see how this plays out.
The yellow lines represent a .618 and .65 fib level.
The blue line is another fib level of interest.
If SHMP does not break to new highs then look below.
Trent Klarenbach
免責聲明
這些資訊和出版物並不意味著也不構成TradingView提供或認可的金融、投資、交易或其他類型的意見或建議。請在使用條款閱讀更多資訊。
Trent Klarenbach
免責聲明
這些資訊和出版物並不意味著也不構成TradingView提供或認可的金融、投資、交易或其他類型的意見或建議。請在使用條款閱讀更多資訊。