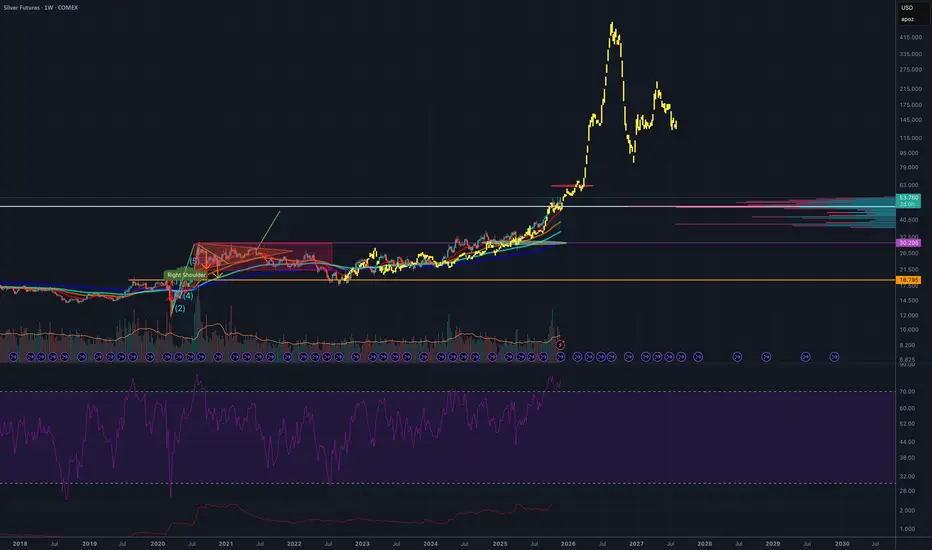
A technical analysis chart that overlays the 1970s silver breakout pattern onto the projected price action for 2025. The chart illustrates how the historical parabolic move that silver experienced during the late-1970s bull cycle could repeat in a modern context. By aligning the timeframes and scaling the price structures, the chart highlights a potential breakout setup forming in 2025 that mirrors the earlier pattern. This visual comparison is used to infer a possible target price for 2026 based on the magnitude and trajectory of the 1970s rally, offering a speculative projection grounded in historical market behavior.
免責聲明
這些資訊和出版物並非旨在提供,也不構成TradingView提供或認可的任何形式的財務、投資、交易或其他類型的建議或推薦。請閱讀使用條款以了解更多資訊。