After a period of decline following its February 2024 peak, Sigachi Industries has shown a dramatic burst of momentum. However, the stock has now reached a critical juncture, and confirmation is required to suggest a sustainable trend reversal.
## Recent Price Action
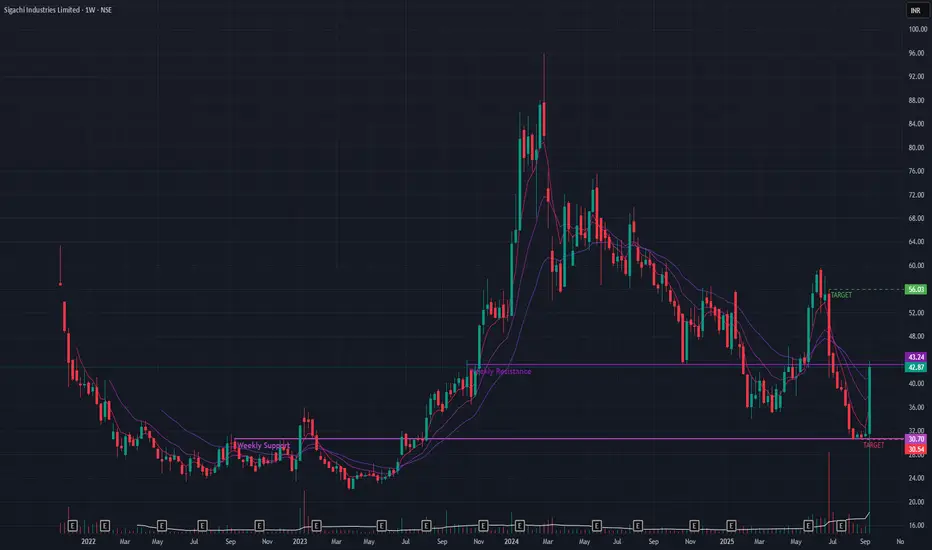
A massive +36.27% rally last week, backed by exceptionally high volume, has put the stock back on the radar. This surge has pushed the price directly against a significant long-term resistance trendline. A breakout above this level would be a major technical victory for the bulls.
## Cautionary Signals to Consider
Despite the powerful rally, several indicators suggest a "wait-and-see" approach:
Trend Confirmation: The stock has not yet formed a higher low, a key technical signal required to confirm a reversal from a downtrend to an uptrend.
EMA Posture: The short-term Exponential Moving Averages (EMAs) have not yet achieved a Positive Crossover (PCO). This indicates that the recent surge, while strong, has not yet been sustained long enough to reverse the short-term trend momentum.
## Key Levels and Outlook
The stock is at a clear decision point.
Bullish Scenario: A decisive breakout above the current resistance trendline, again on high volume, would be a strong bullish signal. If this occurs, the next potential upside target is the ₹56 level.
Bearish Scenario: If the stock fails to breach this resistance and the momentum fades, it could fall back to test support near the ₹30 level.
Wait for further price-action !!
## Recent Price Action
A massive +36.27% rally last week, backed by exceptionally high volume, has put the stock back on the radar. This surge has pushed the price directly against a significant long-term resistance trendline. A breakout above this level would be a major technical victory for the bulls.
## Cautionary Signals to Consider
Despite the powerful rally, several indicators suggest a "wait-and-see" approach:
Trend Confirmation: The stock has not yet formed a higher low, a key technical signal required to confirm a reversal from a downtrend to an uptrend.
EMA Posture: The short-term Exponential Moving Averages (EMAs) have not yet achieved a Positive Crossover (PCO). This indicates that the recent surge, while strong, has not yet been sustained long enough to reverse the short-term trend momentum.
## Key Levels and Outlook
The stock is at a clear decision point.
Bullish Scenario: A decisive breakout above the current resistance trendline, again on high volume, would be a strong bullish signal. If this occurs, the next potential upside target is the ₹56 level.
Bearish Scenario: If the stock fails to breach this resistance and the momentum fades, it could fall back to test support near the ₹30 level.
Wait for further price-action !!
Disclaimer: This analysis is my personal view & for educational purposes only. They shall not be construed as trade or investment advice. Before making any financial decision, it is imperative that you consult with a qualified financial professional.
免責聲明
這些資訊和出版物並非旨在提供,也不構成TradingView提供或認可的任何形式的財務、投資、交易或其他類型的建議或推薦。請閱讀使用條款以了解更多資訊。