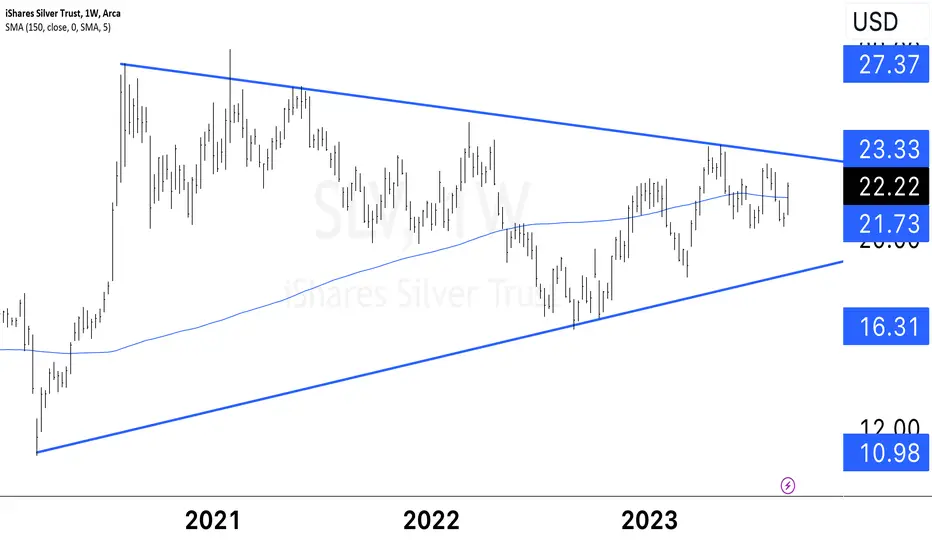
1. **Construction:** A bullish triangle pattern is created by drawing a trend line connecting higher lows and a horizontal resistance line connecting relatively equal highs.
2. **Converging Trend Lines:** As time progresses, the price movements within the triangle become confined within the converging trend lines, forming a contracting triangular shape.
3. **Decreasing Volatility:** The range between the higher lows and lower highs gradually narrows, indicating decreasing volatility and potential indecision among traders.
4. **Bullish Bias:** The bullish nature of this pattern is due to the formation occurring within an established uptrend. It suggests that despite the consolidation, buyers are still active, preventing a significant downward movement.
5. **Breakout:** Eventually, the price will reach the apex of the triangle, where the trend lines intersect. A breakout occurs when the price moves decisively above the horizontal resistance line, confirming the pattern.
6. **Target:** The breakout is usually accompanied by an increase in trading volume, signifying renewed interest. Traders often use the height of the triangle at its widest point as a guide to estimate the potential price move after the breakout.
It's important to note that while bullish triangle patterns can provide insights into potential price movements, they are not guaranteed to result in a specific outcome. False breakouts can occur, where the price initially moves beyond the resistance line but then reverses back into the triangle. To minimize risks, traders often wait for a confirmed breakout, consider using other technical indicators for confirmation, and implement proper risk management strategies.
免責聲明
這些資訊和出版物並非旨在提供,也不構成TradingView提供或認可的任何形式的財務、投資、交易或其他類型的建議或推薦。請閱讀使用條款以了解更多資訊。
免責聲明
這些資訊和出版物並非旨在提供,也不構成TradingView提供或認可的任何形式的財務、投資、交易或其他類型的建議或推薦。請閱讀使用條款以了解更多資訊。