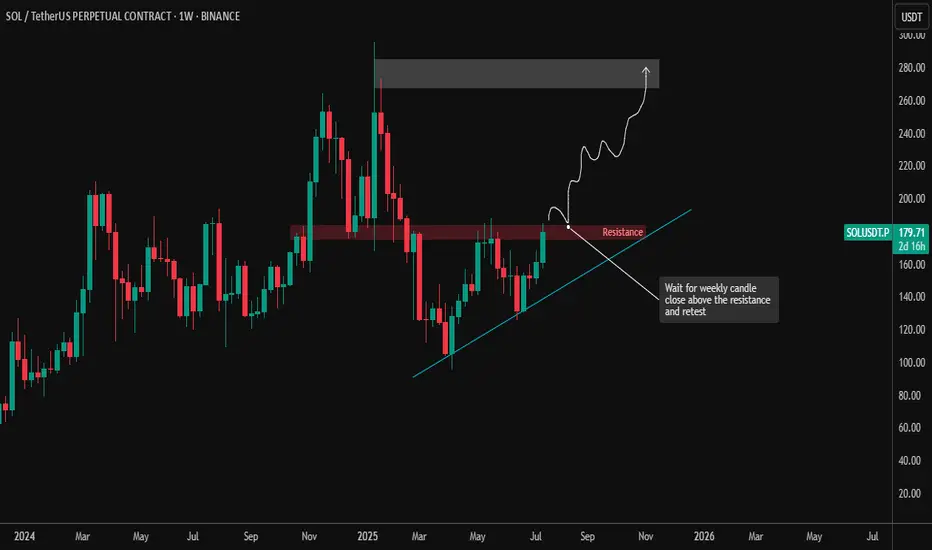
Solana is at a critical breakout point as price pushes against a long-standing horizontal resistance zone between $175–$180. This zone has been tested multiple times since late 2024, making it a significant level to watch.
🔹 Current Price: ~$179.66
🔹 Resistance Zone: $175–$180
🔹 Next Major Supply Zone: $260–$290
🔹 Trendline Support: Still intact and respected since the Q2 lows
📌 Key Setup:
SOL is attempting a breakout above the horizontal resistance.
Price structure shows a series of higher lows, indicating growing bullish momentum.
A weekly candle close above $180 followed by a successful retest would confirm the breakout and could open up upside toward the $260–$290 zone.
📈 Trade Plan:
Breakout Entry: After a confirmed weekly close + bullish retest of $175–$180
Invalidation: Break below trendline and failure to hold above $160
Target: $260–$290 zone, where previous supply stepped in
🧠 Patience is key: Wait for confirmation and don’t chase breakout candles. This level has historically acted as a trap — confirmation is critical for safer entries.
#Solana #SOLUSDT #CryptoTrading #TechnicalAnalysis #Altcoins #Binance
免責聲明
這些資訊和出版物並不意味著也不構成TradingView提供或認可的金融、投資、交易或其他類型的意見或建議。請在使用條款閱讀更多資訊。