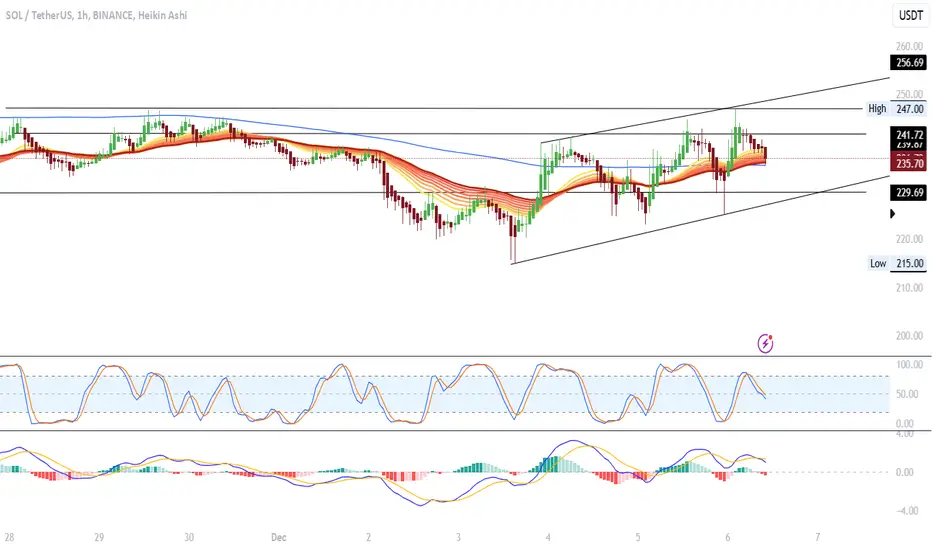
The chart shows a sideways movement with an upward slope, within an ascending channel visible on the 1-hour timeframe. At the moment, the price is close to the dynamic support of the channel, but the indicators show selling pressure.
The EMA (Exponential Moving Average) suggests dynamic resistance, with the price finding it difficult to consistently break above it.
Support:
$229.69
$225.00: Considered a critical support, its loss could signal a broader reversal in the short term.
Resistance:
$241.72
$247.00: Upper resistance on the 1H chart, coinciding with the recent top. A break of this level could propel the price towards $256.69.
RSI (Relative Strength Index):
Indicates selling pressure.
MACD:
Also presents a bearish crossover, reinforcing the sell scenario at the moment.
Although the price of SOL/USDT is inside an ascending channel, the selling pressure indicated by the indicators (RSI and MACD) suggests that the price may test the supports before resuming the uptrend.
免責聲明
這些資訊和出版物並不意味著也不構成TradingView提供或認可的金融、投資、交易或其他類型的意見或建議。請在使用條款閱讀更多資訊。
免責聲明
這些資訊和出版物並不意味著也不構成TradingView提供或認可的金融、投資、交易或其他類型的意見或建議。請在使用條款閱讀更多資訊。