Good day ladies and gents,
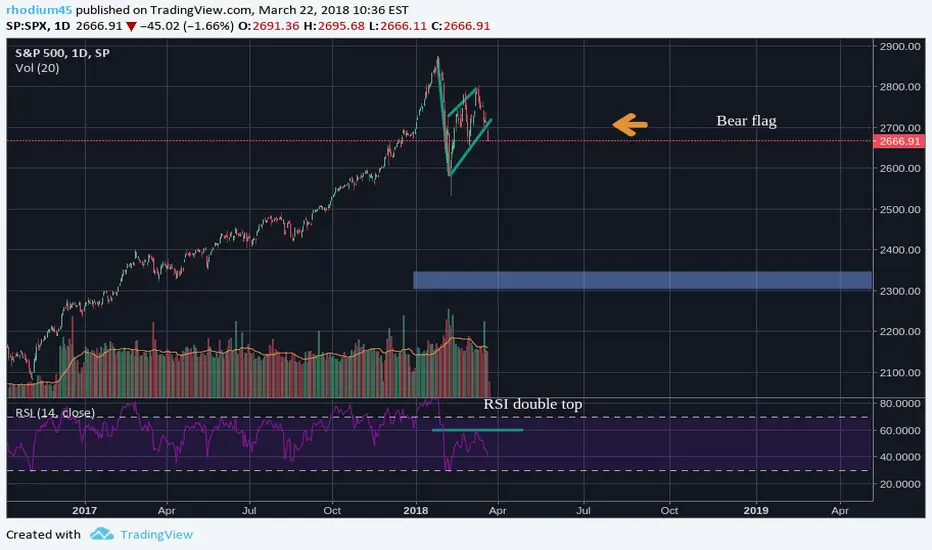
this is my first technical analysis on the SPX and it's clearly not a bullish one. The SPX had an astonishing bullrun over the recent years but a bear flag is marking its end. A double top formed on the RSI(14) indicator which only confirms the bearish breakout. The blue box on the chart acts a support and first target.
Keep in mind that I'm still a novice to TA and don't know too much about it. Feedback, be it positive or negative is very welcome.
Cheers
免責聲明
這些資訊和出版物並不意味著也不構成TradingView提供或認可的金融、投資、交易或其他類型的意見或建議。請在使用條款閱讀更多資訊。
免責聲明
這些資訊和出版物並不意味著也不構成TradingView提供或認可的金融、投資、交易或其他類型的意見或建議。請在使用條款閱讀更多資訊。
