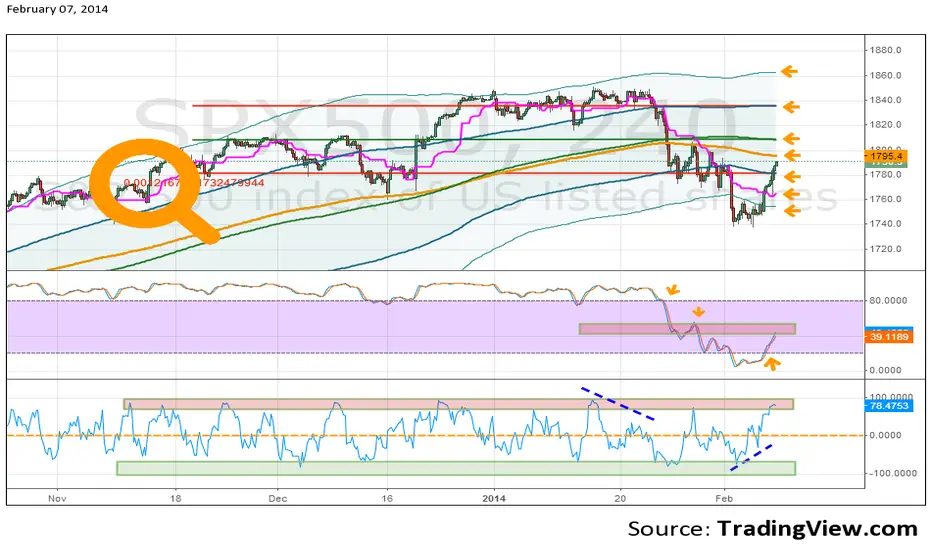
Plot LInear Regression as much as possible horizontal, close to 0.000
With the number YOU get plot EMA, BB with 1&2 deviation and Stoch.
For clues plot Ichimoku standard line and for divergence CMO or other indicators You like - settings according to your trading plan.
YOU can use this system on all timeframes - on lower timeframes You must change settings more often to plot horizontal LINREG... (use also different deviations of LINREG...
just WATCH, DECIDE, INNoVATE and make $$$ - GLT.
免責聲明
這些資訊和出版物並不意味著也不構成TradingView提供或認可的金融、投資、交易或其他類型的意見或建議。請在使用條款閱讀更多資訊。