After completing an ABCD measured move down, which is not shown but which is inherently bullish, the looming question is what lies before us?
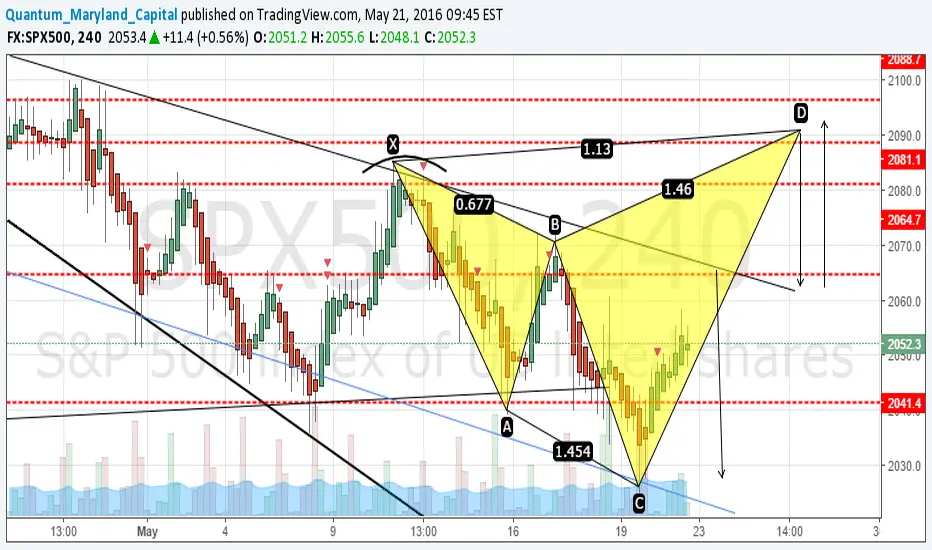
While there are countless possibilities, two stand out: (1) a simple failure at the 50 DMA (2060) or at the channel line at 2065 ish and a resumption of the trend down or (2) the development of a bearish shark.
The shark, though, would require breaking through the upper channel line (also part of a descending bullish wedge) and the right shoulder at 2084 ish of the widely discussed H&S pattern currently in place.
In the event this takes place, the channel line would likely serve as resistance in any move down. Thus, in my eyes the upper channel line will play a large role in determining our fate.
In the event it is breached, the thought of becoming bullish in a market that has endured four or five consecutive quarters of year over year declines in earnings churns my stomach.
The case for the shark or more is made by Tom McClellan here: mcoscillator.com/learning_center/weekly_chart/strong_summation_index_promises_higher_highs/
However, the higher high wherever it is could also simply be a “bow off” top and we have unfavorable seasonality beginning in June.
Thanks for reading and comments are welcome.
.
免責聲明
這些資訊和出版物並不意味著也不構成TradingView提供或認可的金融、投資、交易或其他類型的意見或建議。請在使用條款閱讀更多資訊。
免責聲明
這些資訊和出版物並不意味著也不構成TradingView提供或認可的金融、投資、交易或其他類型的意見或建議。請在使用條款閱讀更多資訊。