Equity Markets Ahead of the US Inflation Report
Today at 15:30 GMT+3, the US inflation report (Consumer Price Index, or CPI) is scheduled for release. According to ForexFactory, analysts expect the inflation rate to rise from 2.4% to 2.6%.
The actual figures will provide market participants with grounds to debate not only the likelihood of a Federal Reserve rate cut, but also the evolving tensions between Donald Trump and Jerome Powell.
Should the report deliver any surprises, it will almost certainly trigger heightened volatility across the equity markets. For now, however, investors are seemingly optimistic about the upcoming fundamental data — especially given the commencement of Q2 earnings season, which lends additional weight to today’s macroeconomic indicators.

Technical Analysis of the S&P 500 Chart
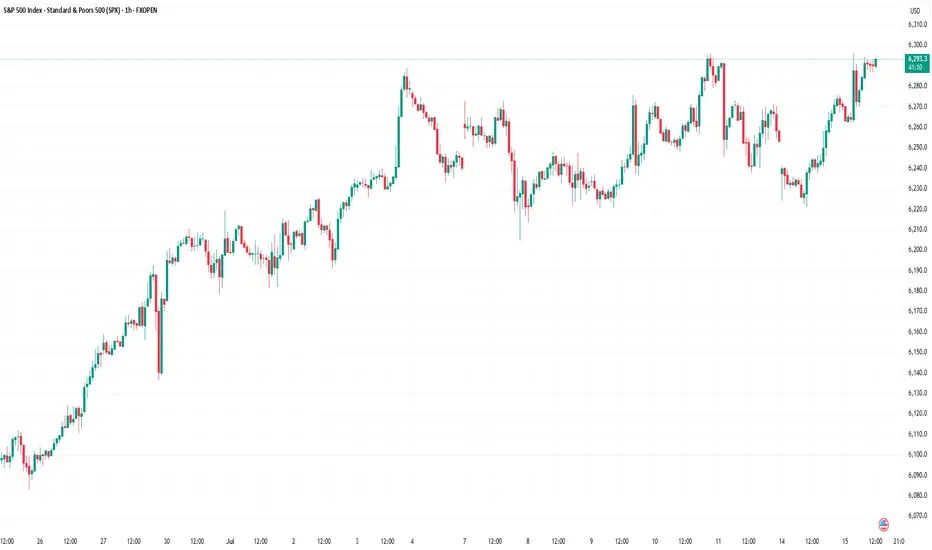
The S&P 500 chart (US SPX 500 mini on FXOpen) shows the index fluctuating within a range defined by support at 6,222 and resistance at 6,290.
The upward impulses (as indicated by arrows) suggest that:
→ current market optimism, combined with the CPI release, may lead to a bullish breakout above resistance and the establishment of a new all-time high;
→ in a broader context, such a breakout could be interpreted as a continuation of the rally that began in April, following a period of consolidation between the aforementioned levels.
This article represents the opinion of the Companies operating under the FXOpen brand only. It is not to be construed as an offer, solicitation, or recommendation with respect to products and services provided by the Companies operating under the FXOpen brand, nor is it to be considered financial advice.
Today at 15:30 GMT+3, the US inflation report (Consumer Price Index, or CPI) is scheduled for release. According to ForexFactory, analysts expect the inflation rate to rise from 2.4% to 2.6%.
The actual figures will provide market participants with grounds to debate not only the likelihood of a Federal Reserve rate cut, but also the evolving tensions between Donald Trump and Jerome Powell.
Should the report deliver any surprises, it will almost certainly trigger heightened volatility across the equity markets. For now, however, investors are seemingly optimistic about the upcoming fundamental data — especially given the commencement of Q2 earnings season, which lends additional weight to today’s macroeconomic indicators.
Technical Analysis of the S&P 500 Chart
The S&P 500 chart (US SPX 500 mini on FXOpen) shows the index fluctuating within a range defined by support at 6,222 and resistance at 6,290.
The upward impulses (as indicated by arrows) suggest that:
→ current market optimism, combined with the CPI release, may lead to a bullish breakout above resistance and the establishment of a new all-time high;
→ in a broader context, such a breakout could be interpreted as a continuation of the rally that began in April, following a period of consolidation between the aforementioned levels.
This article represents the opinion of the Companies operating under the FXOpen brand only. It is not to be construed as an offer, solicitation, or recommendation with respect to products and services provided by the Companies operating under the FXOpen brand, nor is it to be considered financial advice.
免責聲明
這些資訊和出版物並不意味著也不構成TradingView提供或認可的金融、投資、交易或其他類型的意見或建議。請在使用條款閱讀更多資訊。