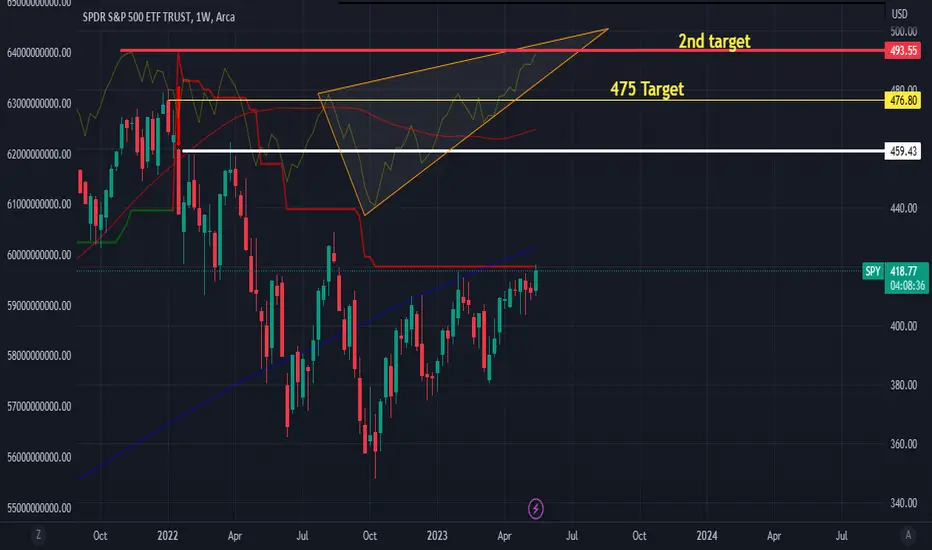
The AD is showing a clear ascending triangle on the spy etf to 475 and 493... I 1st saw the ascending triangle on the spx 500 futures, now its being confirmed on the spy ETF...
This is for the long term traders (buy the dips) yes there will be short scalps here and there but im keeping a base for the long term trade.
added spy this morning on the dip.. anything below 420-418 is great for long term buying.
This is for the long term traders (buy the dips) yes there will be short scalps here and there but im keeping a base for the long term trade.
added spy this morning on the dip.. anything below 420-418 is great for long term buying.
註釋
base forming 註釋
where I saw 4700 on the spx 500 futures likely 4300 then a retrace to C leg to set up the run to 475 
註釋
What im watching for is a D leg retest (may not get it) $415.. X leg is currently acting as support (higher price action) 註釋
support is above 405註釋
weekly view w/ clear resistances at 420 註釋
same chart.. I mentioned earlier support is at 405, because that's where the 50 day moving avg is currently on the weekly. I know some folks are targeting 404 for a short, I say good luck w/ that 註釋
If you follow me and my charts. I do a lot of future forecasting because the market is always adjusting. Looking back on the forecast and seeing where we're at is helpful. Take a look at this chart 註釋
we breached that trendline resistances at 4198註釋
and we broke out of this cup/handle pattern w/ clear conviction this week. 
註釋
The AD is showing me an ascending triangle to 4195 spx500 futures, on the 1min time frame during premarket will be monitoring to see if it carries over to the higher time frames today. 註釋
4hr time frame.. The AD is showing an ascending triangle to $424 btfd註釋
註釋
apex on the 30min chart 註釋
looks like a bull flag set up on 30min chart by the AD 註釋
the powers that be will try to drop this to 415, 註釋
monitor these 4hr levels 註釋
The AD showing an Ascending Triangle on 註釋
Biotech will lift the sp500, this is extremely bullish. Grabbing some cheap calls here for the $420 strike price註釋
spy 30min chart showing an Ascending Triangle 421.50 range.. 註釋
monitoring 註釋
if previous resistances doesnt hold as support, then the short would continue from this forecast. However, Im trusting what the AD has already shown me. The Financial Markets are always in a state of flux, and it's true Money never sleeps. Its always at work stay tune. 
註釋
raise the target to 4900 註釋
4hr sp500 has a bullish set up 免責聲明
這些資訊和出版物並不意味著也不構成TradingView提供或認可的金融、投資、交易或其他類型的意見或建議。請在使用條款閱讀更多資訊。
免責聲明
這些資訊和出版物並不意味著也不構成TradingView提供或認可的金融、投資、交易或其他類型的意見或建議。請在使用條款閱讀更多資訊。